Bethnal Green South West (UK Parliament constituency) facts for kids
Quick facts for kids {{{Name}}}[[{{{Type}}} constituency]] |
|
|---|---|
| [[Image:{{{Map1}}}Constituency.svg|120px|]] [[Image:England{{{Map2}}}.svg|120px|]] |
|
| {{{Name}}} shown within [[{{{Entity}}}]], and {{{Entity}}} shown within England | |
| Created: | {{{Year}}} |
| MP: | {{{MP}}} |
| Party: | {{{Party}}} |
| Type: | House of Commons |
| County: | [[{{{County}}}]] |
| EP constituency: | [[{{{EP}}} (European Parliament constituency)|{{{EP}}}]] |
Bethnal Green South West was an area in London that had its own special representative in the Parliament of the United Kingdom. This representative was called a Member of Parliament (MP). An MP is someone chosen by people in an area to speak for them in the House of Commons, which is where laws are made.
This area was created as a "constituency" (a voting area) for the general election in 1885. It stopped being a separate constituency in 1950. At that time, it joined with another area called Bethnal Green North East. Together, they formed a new constituency simply called Bethnal Green. This change happened because fewer people lived in the area.
Contents
What Was Bethnal Green South West?
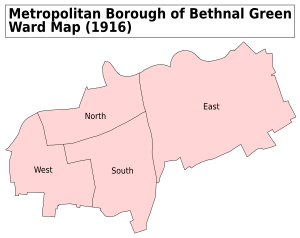
This constituency covered the southern and western parts of Bethnal Green. Bethnal Green was a "civil parish" in Middlesex, which later became part of the Metropolitan Borough of Bethnal Green in the County of London.
From 1885 to 1918, the area included the South and West wards (parts) of the parish of St. Matthew, Bethnal Green.
Who Represented Bethnal Green South West?
The people listed below were the Members of Parliament (MPs) for Bethnal Green South West. They were elected to represent the area in the House of Commons.
| Year | Member | Party | |
|---|---|---|---|
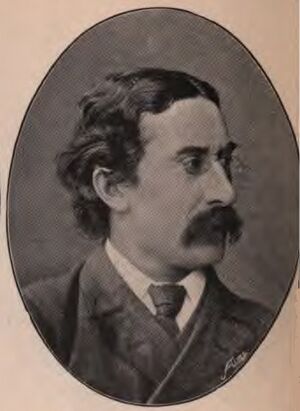
| 1885 | Edward Pickersgill | Liberal | |
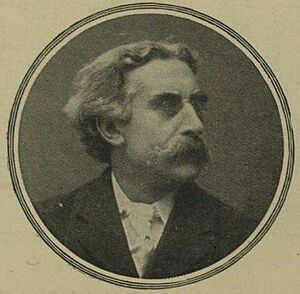
| 1900 | Samuel Forde Ridley | Conservative | |
| 1906 | Edward Pickersgill | Liberal | |
| 1911 | Charles Masterman | Liberal | |
| 1914 | Sir Mathew Wilson | Unionist | |
| 1922 | Percy Harris | Liberal | |
| 1945 | Percy Holman | Labour | |
| 1950 | constituency abolished: see Bethnal Green | ||
Election Highlights
This section looks at some of the key elections that took place in Bethnal Green South West. People voted to choose their Member of Parliament.
Elections in the 1880s
In the first election in 1885, Edward Pickersgill from the Liberal Party won the seat. He beat John Evans Freke Aylmer, a Conservative candidate.
Pickersgill won again in the 1886 general election. He continued to represent Bethnal Green South West.
Elections in the 1890s
Edward Pickersgill kept his seat in the 1892 election. He won against Thomas Benskin, a Conservative.
In the 1895 election, Pickersgill won again. This time, his opponent was William Arnold Statham from the Conservative Party.
Elections in the 1900s
In the 1900 general election, the seat changed hands. Samuel Forde Ridley from the Conservative Party won. He defeated Edward Pickersgill, who had held the seat for many years.
However, Edward Pickersgill won the seat back for the Liberal Party in the 1906 general election. He beat Samuel Ridley.
Elections in the 1910s
Edward Pickersgill won again in both the January 1910 and December 1910 general elections.
After Pickersgill left Parliament, a special election called a "by-election" was held in 1911. Charles Masterman from the Liberal Party won this election.
Another by-election took place in 1914. In this election, Sir Mathew Wilson from the Unionist Party won the seat. He narrowly defeated Charles Masterman.
Sir Mathew Wilson kept his seat in the 1918 general election. He was the candidate for the Unionist Party.
Elections in the 1920s
In the 1922 general election, Percy Harris from the Liberal Party won the seat. He beat candidates from the Communist Party and the Unionist Party.
Percy Harris won again in the 1923 general election. He also won the 1924 election.
He continued to represent the area, winning the 1929 general election for the Liberal Party.
Elections in the 1930s
Percy Harris remained the MP for Bethnal Green South West. He won the 1931 general election with a large number of votes.
He also won the 1935 general election. He continued to be the Liberal MP for the area.
Elections in the 1940s
In the 1945 general election, the seat changed hands again. Percy Holman from the Labour Party won. He defeated Percy Harris, who had been the MP for many years.
This was the last election for Bethnal Green South West as a separate constituency. In 1950, it was combined with another area to form a new constituency.
 | Jessica Watkins |
 | Robert Henry Lawrence Jr. |
 | Mae Jemison |
 | Sian Proctor |
 | Guion Bluford |


