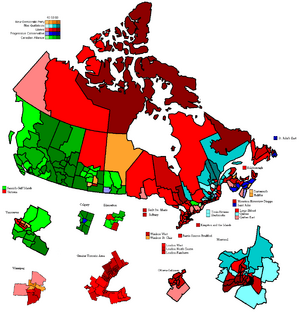
2000 Canadian federal election facts for kids
|
|||||||||||||||||||||||||||||||||||||||||||||||||||||||||||||||||||||||||||||||||||||||||
|
|
|||||||||||||||||||||||||||||||||||||||||||||||||||||||||||||||||||||||||||||||||||||||||
|
301 seats in the House of Commons 151 seats needed for a majority |
|||||||||||||||||||||||||||||||||||||||||||||||||||||||||||||||||||||||||||||||||||||||||
|---|---|---|---|---|---|---|---|---|---|---|---|---|---|---|---|---|---|---|---|---|---|---|---|---|---|---|---|---|---|---|---|---|---|---|---|---|---|---|---|---|---|---|---|---|---|---|---|---|---|---|---|---|---|---|---|---|---|---|---|---|---|---|---|---|---|---|---|---|---|---|---|---|---|---|---|---|---|---|---|---|---|---|---|---|---|---|---|---|---|
| Turnout | 64.1% ( |
||||||||||||||||||||||||||||||||||||||||||||||||||||||||||||||||||||||||||||||||||||||||
|
|||||||||||||||||||||||||||||||||||||||||||||||||||||||||||||||||||||||||||||||||||||||||
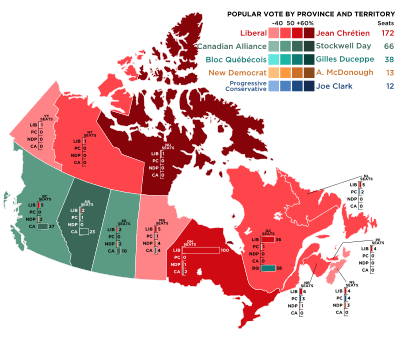
Popular vote by province, with graphs indicating the number of seats won. As this is an FPTP election, seat totals are not determined by popular vote by province but instead via results by each riding.
|
|||||||||||||||||||||||||||||||||||||||||||||||||||||||||||||||||||||||||||||||||||||||||
|
|||||||||||||||||||||||||||||||||||||||||||||||||||||||||||||||||||||||||||||||||||||||||
The 2000 Canadian federal election was a big event held on November 27, 2000. During this election, Canadians voted for 301 people to become Members of Parliament (MPs). These MPs would then represent their local areas in the House of Commons of Canada, which is a key part of Canada's government. This election decided who would lead the country for the next few years.
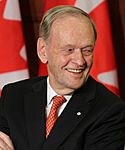
The main goal was to choose members for the 37th Parliament. After the votes were counted, Jean Chrétien remained the Prime Minister. His party, the Liberal Party, won the most seats.
Contents
Understanding the Election Results
In a federal election, people vote for a candidate in their local area, called a "riding." The candidate who gets the most votes in that riding wins a seat in the House of Commons. The party that wins the most seats usually forms the government.
| ↓ | ||||
| 172 | 66 | 38 | 13 | 12 |
| Liberal | Canadian Alliance | BQ | NDP | PC |
| Party | Party leader | Candidates | Seats | Popular vote | ||||||
|---|---|---|---|---|---|---|---|---|---|---|
| 1997 | Dissol. | Elected | % Change | # | % | Change | ||||
| Liberal | Jean Chrétien | 301 | 155 | 161 | 172 | +11.0% | 5,252,031 | 40.85% | +2.39pp | |
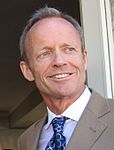
| Alliance | Stockwell Day | 298 | 60 | 58 | 66 | +10.0% | 3,276,929 | 25.49% | +6.13pp1 | |
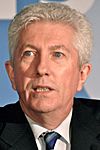
| Bloc Québécois | Gilles Duceppe | 75 | 44 | 44 | 38 | -13.6% | 1,377,727 | 10.72% | +0.04pp | |
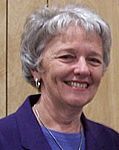
| New Democratic | Alexa McDonough | 298 | 21 | 19 | 13 | -38.1% | 1,093,868 | 8.51% | -2.54pp | |
| Progressive Conservative | Joe Clark | 291 | 20 | 15 | 12 | -40.0% | 1,566,998 | 12.19% | -6.65pp | |
| Green | Joan Russow | 111 | - | - | - | - | 104,402 | 0.81% | +0.38pp | |
| Marijuana | Marc-Boris St-Maurice | 73 | * | - | - | * | 66,258 | 0.52% | * | |
| No affiliation | 57 | - | - | - | - | 37,591 | 0.29% | +0.28pp | ||
| Canadian Action | Paul T. Hellyer | 70 | - | - | - | - | 27,103 | 0.21% | +0.08pp | |
| Independent | 29 | 1 | 4 | - | -100% | 17,445 | 0.14% | -0.32pp | ||
| Natural Law | Neil Paterson | 69 | - | - | - | - | 16,577 | 0.13% | -0.16pp | |
| Marxist–Leninist | Sandra L. Smith | 84 | - | - | - | - | 12,068 | 0.09% | - | |
| Communist | Miguel Figueroa | 52 | * | - | - | * | 8,776 | 0.09% | * | |
| Vacant | - | |||||||||
| Total | 1,808 | 301 | 301 | 301 | ±0.0% | 12,857,773 | 100% | - | ||
| Sources: http://www.elections.ca History of Federal Ridings since 1867 | ||||||||||
Notes:
"% change" refers to change from previous election
* - Party did not nominate candidates in the previous election
1 - percentage change from Reform Party of Canada in previous election.
How Canadians Voted
The election showed how popular each political party was across Canada. This is measured by the "popular vote," which is the total number of votes each party received.
| Popular vote | ||||
|---|---|---|---|---|
| Liberal | 40.85% | |||
| Canadian Alliance | 25.49% | |||
| PC | 12.19% | |||
| Bloc Québécois | 10.72% | |||
| NDP | 8.51% | |||
| Green | 0.81% | |||
| Others | 1.43% | |||
Seats Won by Each Party
While the popular vote shows overall support, what really matters for forming a government is the number of seats each party wins. The party with the most seats gets to lead the country.
| Seat totals | ||||
|---|---|---|---|---|
| Liberal | 57.14% | |||
| Canadian Alliance | 21.93% | |||
| Bloc Québécois | 12.62% | |||
| NDP | 4.32% | |||
| PC | 3.99% | |||
Party Performance Across Canada
The results varied quite a bit from one province to another. Here's a look at how the main parties did in different parts of Canada:
Liberal Party Success
The Liberal Party, led by Prime Minister Jean Chrétien, won a strong majority of seats. They did especially well in Ontario, winning 100 out of 103 seats there. They also won many seats in Quebec and the Atlantic provinces like Newfoundland and Labrador and Prince Edward Island. Overall, they secured 172 seats.
Rise of the Canadian Alliance
The Canadian Alliance party, led by Stockwell Day, was a newer party that gained a lot of support in western Canada. They won most of their 66 seats in BC and Alberta, becoming the main opposition party.
Bloc Québécois in Quebec
The Bloc Québécois, led by Gilles Duceppe, focuses on issues important to Quebec. They won 38 seats, all within Quebec, showing strong support in that province.
New Democratic Party Results
The New Democratic Party (NDP), led by Alexa McDonough, won 13 seats. Their support was spread out, with some seats in western provinces like Manitoba and Saskatchewan, and also in Nova Scotia.
Progressive Conservative Party
The Progressive Conservative Party, led by Joe Clark, won 12 seats. They saw some support in the Atlantic provinces, but their overall number of seats decreased compared to the previous election.
Other Parties in the Election
Several other parties also ran candidates in the election, but they did not win any seats. These included the Green Party, the Marijuana Party of Canada, and the Communist Party of Canada.
Source: Elections Canada
See also
 In Spanish: Elecciones federales de Canadá de 2000 para niños
 | Misty Copeland |
 | Raven Wilkinson |
 | Debra Austin |
 | Aesha Ash |


