
Castle, Swansea facts for kids
Quick facts for kids Castle
|
|
|---|---|
 Location of the (pre-2022) Castle community within Swansea |
|
| Population | 15,883 (2011) |
| OS grid reference | SS6593 |
| Community |
|
| Principal area | |
| Ceremonial county | |
| Country | Wales |
| Sovereign state | United Kingdom |
| Post town | SWANSEA |
| Postcode district | SA1 |
| Dialling code | 01792 |
| Police | South Wales |
| Fire | Mid and West Wales |
| Ambulance | Welsh |
| EU Parliament | Wales |
| UK Parliament |
|
| Welsh Assembly |
|

Castle (which is Castell in Welsh) is a special area in the city of Swansea, Wales. It's known as both a "community" and an "electoral ward." This means it's a defined area for local government and for voting. Castle covers most of the main part of Swansea city, and the historic Swansea Castle is right in the middle of it.
Contents
What is Castle Like?
The Castle electoral ward is the same as its community area. It includes parts of the Swansea city centre, along with other neighbourhoods like Brynmelin, Dyfatty, Greenhill, and parts of Mount Pleasant, Sandfields, and Waun Wen.
This area is part of the Swansea West parliamentary region. Castle is surrounded by other wards: St. Thomas to the east, Landore and Cwmbwrla to the north, Townhill and Uplands to the west, and Waterfront to the south.
For voting, Castle is split into smaller areas called polling districts. These include City Centre, Sandfields, George Street, Mount Pleasant, and others. Castle elects four councillors to represent its residents on the local council. It's also a "Communities First" area, which means it gets special support to help local people and improve the area.
Castle community does not have its own separate community council.
Changes to Castle's Borders
In 2021, there was a review of local government boundaries. Because of this, the Maritime Quarter area, which used to be part of Castle, was moved to become part of a new Waterfront ward. This change started with the local elections in 2022. Even though Castle ward became a bit smaller, it still elects four county councillors.
Who Lives in Castle?
According to the 2011 UK Census, the total number of people living in the Castle ward and community was 15,883.
Here's a quick look at the different ethnic groups living there in 2011:
| Ethnic group | Count | % |
|---|---|---|
| White British | 11,742 | 73.9 |
| White Irish | 105 | 0.7 |
| White Other | 834 | 5.3 |
| Black/African/Caribbean | 400 | 2.5 |
| Asian | 1,862 | 11.7 |
| Mixed ethnicity | 213 | 1.3 |
| Other (e.g. Arab) | 727 | 4.6 |
About 7,321 people (46.1%) living in Castle identified themselves as Welsh. This number is lower than the average for the whole of Swansea county.
Local Elections in Castle

Since 1995, Castle ward has elected four councillors to the City and County of Swansea Council. The Labour Party is very strong in this area, meaning they usually win most of the seats.
In the 2017 local elections, all four winning councillors were from the Labour Party. They were Sybil Edith Crouch, Erika Theresa Kirchner, Fiona Margaret Gordon, and David Phillips. Many other parties also put forward candidates, including the Conservative Party, Plaid Cymru, United Kingdom Independence Party, Liberal Democrats, Green Party, and the Trade Unionist and Socialist Coalition. The voter turnout in 2017 was 29.8%.
Similarly, in the May 2012 election, all four councillors elected for Castle ward were also from the Labour Party. These were Erika Theresa Kirchner, Sybil Crouch, David Phillips, and Fiona Margaret Gordon.
Before the 2012 election, the councillors for Castle Ward were Erika Kirchner, Alan Lloyd, and David Phillips, all from the Labour Party. Councillor Barbara Hynes, who had served Castle for 21 years, sadly passed away in September 2011, which led to a special by-election.
In the 2008 local elections, 21 people ran for the four available seats. The four sitting Labour councillors aimed to keep their positions. The Conservative Party, Plaid Cymru, and the Liberal Democrats each had four candidates. There was also one candidate from the Socialist Party.
In 1999, the number of council seats for Castle increased from three to four. David Phillips, who won a seat that year, had previously represented the Uplands ward.
The very first election for the new City and County of Swansea Council happened in 1995. In that election, all three seats for Castle were won by the Labour Party.
Images for kids
-
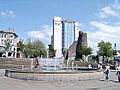
Castle Plaza, a busy spot in the heart of Castle
-
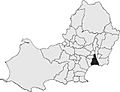
A view of the Castle ward area.
