Cohasset, Minnesota facts for kids
Quick facts for kids
Cohasset
|
|
|---|---|

Cohasset City Hall, Election Day 2024
|
|

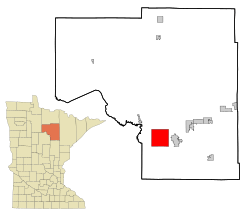
Location of the city of Cohasset
within Itasca County, Minnesota |
|
| Country | United States |
| State | Minnesota |
| County | Itasca |
| Area | |
| • Total | 35.24 sq mi (91.27 km2) |
| • Land | 26.88 sq mi (69.62 km2) |
| • Water | 8.36 sq mi (21.65 km2) |
| Elevation | 1,283 ft (391 m) |
| Population
(2020)
|
|
| • Total | 2,689 |
| • Density | 100.04/sq mi (38.62/km2) |
| Time zone | UTC-6 (Central (CST)) |
| • Summer (DST) | UTC-5 (CDT) |
| ZIP code |
55721
|
| Area code(s) | 218 |
| FIPS code | 27-12412 |
| GNIS feature ID | 0655774 |
| Website | www.cohasset-mn.com |
Cohasset (pronounced koh-HASS-ət) is a city located in Itasca County, Minnesota, United States. In 2020, about 2,689 people lived there.
U.S. Highway 2 is a major road that runs through Cohasset.
Contents
History of Cohasset
A post office opened in Cohasset way back in 1892. The city got its name from another town called Cohasset, Massachusetts.
Geography of Cohasset
Cohasset covers a total area of about 35.29 square miles (91.27 square kilometers). Most of this area is land, about 26.81 square miles (69.62 square kilometers), while the rest is water.
Cohasset is located at the western edge of Minnesota's famous Iron Range. The Iron Range is an area known for its rich iron ore deposits. The city is also right next to Grand Rapids.
Climate in Cohasset
Cohasset experiences a climate with warm summers and very cold winters. Here's a look at the typical weather:
| Climate data for Cohasset, Minnesota, 1991–2020 normals, extremes 1895–present | |||||||||||||
|---|---|---|---|---|---|---|---|---|---|---|---|---|---|
| Month | Jan | Feb | Mar | Apr | May | Jun | Jul | Aug | Sep | Oct | Nov | Dec | Year |
| Record high °F (°C) | 53 (12) |
60 (16) |
81 (27) |
92 (33) |
101 (38) |
98 (37) |
103 (39) |
98 (37) |
99 (37) |
88 (31) |
73 (23) |
60 (16) |
103 (39) |
| Mean maximum °F (°C) | 36.3 (2.4) |
44.6 (7.0) |
58.0 (14.4) |
71.5 (21.9) |
83.0 (28.3) |
86.8 (30.4) |
88.1 (31.2) |
87.6 (30.9) |
82.9 (28.3) |
74.1 (23.4) |
54.1 (12.3) |
40.3 (4.6) |
90.2 (32.3) |
| Mean daily maximum °F (°C) | 17.8 (−7.9) |
23.5 (−4.7) |
36.8 (2.7) |
50.2 (10.1) |
64.6 (18.1) |
73.3 (22.9) |
78.3 (25.7) |
76.4 (24.7) |
68.0 (20.0) |
52.2 (11.2) |
36.1 (2.3) |
22.6 (−5.2) |
50.0 (10.0) |
| Daily mean °F (°C) | 7.5 (−13.6) |
12.1 (−11.1) |
25.6 (−3.6) |
39.4 (4.1) |
53.0 (11.7) |
62.4 (16.9) |
67.4 (19.7) |
65.6 (18.7) |
57.2 (14.0) |
42.9 (6.1) |
28.1 (−2.2) |
14.0 (−10.0) |
39.6 (4.2) |
| Mean daily minimum °F (°C) | −2.9 (−19.4) |
0.6 (−17.4) |
14.4 (−9.8) |
28.5 (−1.9) |
41.4 (5.2) |
51.6 (10.9) |
56.5 (13.6) |
54.8 (12.7) |
46.4 (8.0) |
33.6 (0.9) |
20.1 (−6.6) |
5.3 (−14.8) |
29.2 (−1.5) |
| Mean minimum °F (°C) | −24.9 (−31.6) |
−20.3 (−29.1) |
−9.3 (−22.9) |
15.3 (−9.3) |
27.5 (−2.5) |
38.0 (3.3) |
46.5 (8.1) |
44.1 (6.7) |
32.3 (0.2) |
22.3 (−5.4) |
3.7 (−15.7) |
−15.8 (−26.6) |
−26.6 (−32.6) |
| Record low °F (°C) | −57 (−49) |
−59 (−51) |
−50 (−46) |
−17 (−27) |
14 (−10) |
20 (−7) |
33 (1) |
24 (−4) |
12 (−11) |
−1 (−18) |
−45 (−43) |
−47 (−44) |
−59 (−51) |
| Average precipitation inches (mm) | 0.77 (20) |
0.73 (19) |
1.10 (28) |
1.80 (46) |
3.07 (78) |
4.63 (118) |
4.23 (107) |
3.39 (86) |
3.12 (79) |
2.55 (65) |
1.34 (34) |
1.01 (26) |
27.74 (706) |
| Average snowfall inches (cm) | 9.6 (24) |
6.6 (17) |
5.7 (14) |
3.7 (9.4) |
0.0 (0.0) |
0.0 (0.0) |
0.0 (0.0) |
0.0 (0.0) |
0.0 (0.0) |
1.4 (3.6) |
8.4 (21) |
8.4 (21) |
43.8 (110) |
| Average precipitation days (≥ 0.01 in) | 8.2 | 7.0 | 6.9 | 8.4 | 12.2 | 13.1 | 11.6 | 9.9 | 11.0 | 10.5 | 8.8 | 8.3 | 115.9 |
| Average snowy days (≥ 0.1 in) | 6.5 | 5.1 | 3.9 | 1.5 | 0.0 | 0.0 | 0.0 | 0.0 | 0.0 | 0.8 | 4.2 | 7.2 | 29.2 |
| Source 1: NOAA | |||||||||||||
| Source 2: National Weather Service | |||||||||||||
Population of Cohasset
The population of Cohasset has changed over the years. Here's a quick look at how many people have lived there during different census counts:
| Historical population | |||
|---|---|---|---|
| Census | Pop. | %± | |
| 1910 | 521 | — | |
| 1920 | 420 | −19.4% | |
| 1930 | 299 | −28.8% | |
| 1940 | 389 | 30.1% | |
| 1950 | 484 | 24.4% | |
| 1960 | 605 | 25.0% | |
| 1970 | 536 | −11.4% | |
| 2000 | 2,481 | — | |
| 2010 | 2,698 | 8.7% | |
| 2020 | 2,689 | −0.3% | |
| U.S. Decennial Census | |||
2010 Census Information
In 2010, there were 2,698 people living in Cohasset. There were 1,067 households, which are groups of people living together in homes. The city had about 100 people per square mile.
Most of the people in Cohasset were White (94.9%). A smaller number were Native American (2.0%) or from two or more races (2.5%). About 0.6% of the population was Hispanic or Latino.
The average age in Cohasset was 46 years old. About 23.2% of the people were under 18 years old. About 16.3% were 65 years or older. The population was almost evenly split between males (50.3%) and females (49.7%).
See also
 In Spanish: Cohasset (Minnesota) para niños
 | Aurelia Browder |
 | Nannie Helen Burroughs |
 | Michelle Alexander |

