Colwich, Kansas facts for kids
Quick facts for kids
Colwich, Kansas
|
|
|---|---|

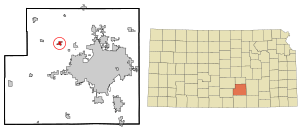
Location within Sedgwick County and Kansas
|
|

|
|
| Country | United States |
| State | Kansas |
| County | Sedgwick |
| Founded | 1887 |
| Incorporated | 1887 |
| Area | |
| • Total | 1.33 sq mi (3.46 km2) |
| • Land | 1.33 sq mi (3.46 km2) |
| • Water | 0.00 sq mi (0.00 km2) |
| Elevation | 1,381 ft (421 m) |
| Population
(2020)
|
|
| • Total | 1,455 |
| • Density | 1,094/sq mi (420.5/km2) |
| Time zone | UTC-6 (CST) |
| • Summer (DST) | UTC-5 (CDT) |
| ZIP code |
67030
|
| Area code | 316 |
| FIPS code | 20-15100 |
| GNIS ID | 473814 |
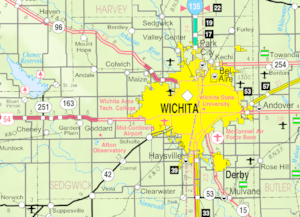
Colwich is a small city in Sedgwick County, Kansas. It is located northwest of the larger city of Wichita. In 2020, about 1,455 people lived in Colwich. It's a quiet community with a rich history.
Contents
History of Colwich
Colwich was started in 1887. Its name is a mix of "Colorado" and "Wichita." This name comes from the Colorado & Wichita Railroad. The railroad played a big part in the city's early days.
Geography of Colwich
Colwich is found at 37°46′50″N 97°32′26″W / 37.78056°N 97.54056°W. It is located northwest of Wichita. The city is centered around the crossing of 53rd Street North and 167th Street West.
The United States Census Bureau says Colwich covers about 1.33 square miles (3.46 square kilometers). All of this area is land. There are no large bodies of water within the city limits.
People of Colwich (Demographics)
| Historical population | |||
|---|---|---|---|
| Census | Pop. | %± | |
| 1890 | 212 | — | |
| 1900 | 225 | 6.1% | |
| 1910 | 258 | 14.7% | |
| 1920 | 262 | 1.6% | |
| 1930 | 260 | −0.8% | |
| 1940 | 284 | 9.2% | |
| 1950 | 339 | 19.4% | |
| 1960 | 703 | 107.4% | |
| 1970 | 879 | 25.0% | |
| 1980 | 935 | 6.4% | |
| 1990 | 1,091 | 16.7% | |
| 2000 | 1,229 | 12.6% | |
| 2010 | 1,327 | 8.0% | |
| 2020 | 1,455 | 9.6% | |
| U.S. Decennial Census | |||
Colwich is part of the larger Wichita, KS Metropolitan Statistical Area. This means it's connected to the economy and community of Wichita.
2020 Census Information
In 2020, the 2020 United States census counted 1,455 people living in Colwich. There were 535 households, and 404 of these were families. The city had about 1,090 people per square mile.
Most people in Colwich were white (about 93.75%). A small number of people were from other racial backgrounds. About 3.37% of the population was Hispanic or Latino.
Many households (40.2%) had children under 18 living there. Most households (59.1%) were married couples. The average household had 2.8 people. The average family had 3.2 people.
The median age in Colwich was 33.9 years. This means half the people were younger and half were older than 33.9. About 27.2% of the people were under 18 years old. About 13.8% were 65 years or older.
2010 Census Information
The census in 2010 counted 1,327 people in Colwich. There were 466 households and 348 families. The population density was about 998 people per square mile.
Most people (97.4%) were White. About 2.5% of the population was Hispanic or Latino.
About 44.6% of households had children under 18. Most households (59.7%) were married couples living together. The average household size was 2.85 people. The average family size was 3.38 people.
The median age in 2010 was 32.7 years. About 34.3% of residents were under 18. About 11.1% were 65 or older. The number of males and females was almost equal.
Education
Students in Colwich attend schools in the Renwick USD 267 public school district. This district serves the community's educational needs.
See also
 In Spanish: Colwich (Kansas) para niños
 | Jessica Watkins |
 | Robert Henry Lawrence Jr. |
 | Mae Jemison |
 | Sian Proctor |
 | Guion Bluford |

