
2009 southeastern Australia heat wave facts for kids

Approximate affected area shown in red
|
|
| Areas | South Australia, Victoria, Southern New South Wales, Northern Tasmania, ACT |
|---|---|
| Start date | 25 January 2009 |
| End date | 9 February 2009 |
| Peak temp. | 48.8 °C (119.8 °F), recorded at Hopetoun, Victoria |
| Losses | |
| Deaths | 374 |
| Injuries | 2,000+ |
The 2009 southeastern Australia heat wave was a time of extremely hot weather that hit parts of Australia in early 2009. It started in late January and brought record-breaking high temperatures that lasted for a long time. Many people consider this one of the most intense heat waves ever in this part of Australia.
During this heat wave, over 50 different places set new records for how many days in a row it was hot, the highest temperatures during the day, and even the highest temperatures at night. The hottest temperature recorded was 48.8 °C (119.8 °F) in Hopetoun, Victoria. This was a new record for the state of Victoria! Big cities like Adelaide and Melbourne also saw incredibly high temperatures. Adelaide reached 45.7 °C (114.3 °F), its third-highest temperature ever. Melbourne recorded its highest temperature on record, 46.4 °C (115.5 °F). Both cities also broke records for how many days in a row the temperature stayed above 40 °C (104 °F).
This super hot weather was caused by a slow-moving area of high pressure that settled over the Tasman Sea. At the same time, there was a strong tropical low near the North West Australian coast and a monsoon trough over Northern Australia. These weather systems worked together to pull hot, tropical air down into southeastern Australia.
The heat began in South Australia on January 25, 2009. By January 27, it had spread across most of southeastern Australia. A small cool change brought some relief to southern coastal areas on January 30. In Melbourne, for example, temperatures dropped to about 30.8 °C (87.4 °F) that evening. However, the extreme heat returned the next weekend. On February 7, Melbourne had its hottest day since records began in 1855, reaching 46.4 °C (115.5 °F).
The heat wave also created very dangerous conditions for fires. It happened during the peak of the 2008–09 Australian bushfire season. This led to many bushfires in the affected areas, including the terrible Black Saturday bushfires on February 7, which sadly caused 173 people to lose their lives in Victoria.
Contents
Why Was It So Hot?
The main reason for the heat wave was a large area of high pressure that moved very slowly over the Tasman Sea. This high-pressure system, combined with a strong tropical low-pressure system and a monsoon trough in northern Australia, pulled hot, humid air from the tropics down to southeastern Australia. This made temperatures rise a lot. Scientists from the CSIRO (Australia's national science agency) said that this warm, high-pressure system was the key weather pattern behind the heat wave. Many experts called it the worst heat wave in Australia's history.
New Temperature Records
During the 2009 heat wave, many places broke their old temperature records.
- Tasmania recorded its highest-ever temperature: 42.2 °C (108 °F) in Scamander.
- The previous record for Tasmania (40.8 °C (105.4 °F)) was broken five times in just two days!
- Hopetoun in Victoria recorded the highest temperature of the entire heat wave: 48.8 °C (119.8 °F). This was also Victoria's highest temperature ever.
Adelaide, South Australia Records
- The average daily maximum temperature from January 27 to February 7 was 40.5 °C (104.9 °F). This was much hotter than usual.
- It was over 33 °C (91 °F) for 13 days in a row.
- It was over 40 °C (104 °F) for 6 days in a row.
- It was over 43 °C (109 °F) for 4 days in a row.
Melbourne, Victoria Records
- The average daily maximum temperature from January 27 to February 7 was 35.9 °C (96.6 °F).
- It was over 28 °C (82 °F) for 12 days in a row.
- It was over 30 °C (86 °F) for 5 days in a row.
- It was over 43 °C (109 °F) for 3 days in a row.
Mildura, Victoria Records
- It was over 40 °C (104 °F) for 12 days in a row.
- It was over 42 °C (108 °F) for 5 days in a row.
Wagga Wagga, New South Wales Records
- It was over 35 °C (95 °F) for 14 days in a row.
- It was over 37.8 °C (100.0 °F) for 13 days in a row.
- It was over 40 °C (104 °F) for 4 days in a row.
Daily Temperatures During the Heat Wave
Mildura, Victoria
.png)
- January 26: 38.0 °C (100.4 °F)
- January 27: 41.5 °C (106.7 °F)
- January 28: 43.7 °C (110.7 °F)
- January 29: 42.8 °C (109.0 °F)
- January 30: 43.3 °C (109.9 °F)
- January 31: 44.1 °C (111.4 °F)
- February 1: 42.9 °C (109.2 °F)
- February 2: 42.6 °C (108.7 °F)
- February 3: 40.1 °C (104.2 °F)
- February 4: 40.9 °C (105.6 °F)
- February 5: 41.1 °C (106.0 °F)
- February 6: 43.1 °C (109.6 °F)
- February 7: 46.7 °C (116.1 °F) – This was the 12th day in a row over 40°C!
- February 8: 34.6 °C (94.3 °F)
Melbourne, Victoria
Temperatures have been recorded in Melbourne since 1855.
.png)

- January 27: 36.4 °C (97.5 °F)
- January 28: 43.4 °C (110.1 °F)
- January 29: 44.3 °C (111.7 °F)
- January 30: 45.1 °C (113.2 °F) – This was the third-hottest day ever recorded in Melbourne.
- January 31: 30.5 °C (86.9 °F)
- February 1: 33.8 °C (92.8 °F)
- February 2: 28.5 °C (83.3 °F)
- February 3: 30.2 °C (86.4 °F)
- February 4: 30.2 °C (86.4 °F)
- February 5: 29.2 °C (84.6 °F)
- February 6: 33.1 °C (91.6 °F)
- February 7: 46.4 °C (115.5 °F) – This was the hottest day ever recorded in Melbourne!
Adelaide, South Australia
- January 26: 36.6 °C (97.9 °F)
- January 27: 43.2 °C (109.8 °F)
- January 28: 45.7 °C (114.3 °F)
- January 29: 43.4 °C (110.1 °F)
- January 30: 43.1 °C (109.6 °F)
- January 31: 41.1 °C (106.0 °F)
- February 1: 40.6 °C (105.1 °F)
- February 2: 38.8 °C (101.8 °F)
- February 3: 36.3 °C (97.3 °F)
- February 4: 33.0 °C (91.4 °F)
- February 5: 35.6 °C (96.1 °F)
- February 6: 43.9 °C (111.0 °F)
- February 7: 41.5 °C (106.7 °F)
On January 29, 2009, Adelaide also had a record-high minimum temperature. Around midnight, the temperature only dropped to 33.9 °C (93.0 °F) near the city center.
Wagga Wagga, New South Wales
.png)
- January 26: 37.7 °C (99.9 °F)
- January 27: 37.9 °C (100.2 °F)
- January 28: 39.2 °C (102.6 °F)
- January 29: 40.7 °C (105.3 °F)
- January 30: 41.2 °C (106.2 °F)
- January 31: 41.6 °C (106.9 °F)
- February 1: 41.6 °C (106.9 °F)
- February 2: 39.0 °C (102.2 °F)
- February 3: 39.4 °C (102.9 °F)
- February 4: 38.1 °C (100.6 °F)
- February 5: 41.7 °C (107.1 °F)
- February 6: 42.8 °C (109.0 °F)
- February 7: 45.2 °C (113.4 °F) – This was the hottest day recorded in Wagga Wagga since records began in 1941.
- February 8: 42.7 °C (108.9 °F)
Wagga Wagga broke several records for consecutive hot days. On February 8, it had 13 days in a row over 37.8 °C (100.0 °F), and 14 days in a row over 35.0 °C (95.0 °F).
Bushfires During the Heat Wave
After a quiet start to the 2008–09 Australian bushfire season, the extreme heat and strong winds caused many bushfires across Victoria and South Australia. These conditions were very similar to a heat wave in January 1939, which led to the deadly Black Friday bushfires.
Lightning strikes from dry thunderstorms also started fires in the Australian Alps. These fires were in north-east Victoria and south-east New South Wales.
The end of the heat wave also led to the devastating Black Saturday bushfires. These fires sadly caused 173 people to lose their lives. Over 2,000 homes were destroyed in various places across Victoria. Many areas recorded their highest temperatures ever, and winds reached speeds of up to 110 km/h.
How This Heat Wave Was Different
Many areas in central South Australia, northern Victoria, and inland New South Wales often get temperatures over 40 °C (104 °F) for a few days in summer. However, during this heat wave, these regions experienced temperatures over 40 °C (104 °F) for twice as long, or even more, than usual. Coastal areas and the ACT also had higher-than-average temperatures that lasted for a long time.
Even though coastal areas might have had shorter periods of extreme heat, they still reached some of their top temperature records. For example, Melbourne had only 3 days in a row over 43 °C (109 °F). But when you include the record set on February 7, three of its five hottest days ever happened during this heat wave.
The heat wave was especially extreme in northern and eastern Tasmania. Seven of the eight highest temperatures ever recorded in Tasmania up to that time happened during this heat wave.
Effects of the Heat Wave
Power Problems
Many areas experienced power outages during the heat wave. It's thought that over 500,000 people in Melbourne lost power on the evening of January 30, 2009. This affected central Melbourne, causing trains and trams to stop. People had to be rescued from lifts, and shows at the Victorian Arts Centre were cancelled.
Power outages also happened in the western part of the city. This was partly due to an explosion at South Morang that affected power lines. The heat wave put a lot of strain on the power system, especially with so many air conditioners running.
Transport Issues
During the week, thousands of train and tram services were cancelled in Melbourne and Adelaide. In Melbourne alone, over 1,300 train services were cancelled. This happened because the heat caused train tracks to bend. Air conditioners on trains also failed, and there were power outages. On January 30, public transport in Melbourne was free because the government admitted problems with the system handling the heat.
Australian Open Tennis
Several outdoor matches at the 2009 Australian Open on January 29 and 30 were cancelled because of the extreme heat. Some players, including Novak Djokovic, had to stop playing their matches because of the temperature. Serena Williams said it was so hot on court that she felt like she was having an "out-of-body experience". After these issues, the organizers decided to close the roof on some courts and give players longer breaks and icepacks.
Human Health
The heat wave sadly affected many people's health. Hundreds of people needed treatment for heat-related illnesses. Sadly, 374 people passed away because of the heat wave, and over 2,000 people needed medical help for heat stroke and other heat-related problems. Ambulance services saw a 70% increase in emergency calls during that week.
Animals and Plants
The extreme heat was also very hard on wildlife. Baby birds, possums, and bats struggled to cope. The RSPCA (a animal welfare organization) received five times the usual number of animals at its shelters in Melbourne.
There were many reports of koalas coming into people's yards and houses to drink water. This is very unusual because koalas normally don't drink water and are shy around people.
In Melbourne, many trees, especially those not native to Australia, started losing their leaves early. It looked like autumn in early February. Water restrictions meant that many trees and plants were already stressed. Some street trees and plants in parks and private gardens died or were damaged because of the heat.
Images for kids
-
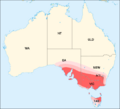
Approximate affected area shown in red
-
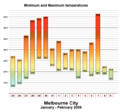
Temperature graph for Melbourne during the peak of the heatwave.
-
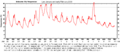
Detailed temperature graph for Melbourne during the peak of the heatwave.
-
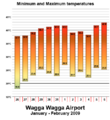
Graph of minimum and maximum temperatures recorded at the Wagga Wagga Airport.
See Also
- Extreme weather events in Melbourne
- 2008–09 Australian bushfire season
- Black Saturday bushfires
Other big Australian heat waves:
- Black Friday bushfires – 438 people passed away
- 1895–96, southeastern states – 437 people passed away
- 1907–08, southeastern states – 246 people passed away
