
List of governors of Nevada facts for kids
Quick facts for kids Governor of Nevada |
|
|---|---|

Standard of the governor of Nevada
|
|

Seal of Nevada
|
|
| Government of Nevada | |
| Style |
|
| Residence | Nevada Governor's Mansion |
| Term length | Four years, renewable once |
| Constituting instrument | Constitution of Nevada |
| Precursor | Governor of the Nevada Territory |
| Inaugural holder | Henry G. Blasdel |
| Formation | December 5, 1864 |
| Succession | Line of succession |
| Deputy | Lieutenant Governor of Nevada |
| Salary | $149,730 (2015) |

The governor of Nevada is like the main leader of the state government in Nevada. They are in charge of the executive branch, which carries out the state's laws. The governor also leads Nevada's military forces, like the Nevada National Guard.
Their job is to make sure state laws are followed. They can approve or reject new laws from the state legislature. They can also call the legislature together for special meetings. And, in most cases, they can forgive people for certain crimes.
A governor serves for four years. Since 1970, a governor can only serve two terms, even if they are not back-to-back. The Lieutenant Governor is elected separately. If the governor's office becomes empty, the Lieutenant Governor takes over.
The current governor is Joe Lombardo, a Republican. He started his term on January 2, 2023.
Contents
Nevada's Governors: A Look Back
This section lists all the people who have served as governor of Nevada. It includes governors from when Nevada was a territory and after it became a state.
Governors of Nevada Territory
The Nevada Territory was created on March 2, 1861. It was formed from part of the Utah Territory. Before Nevada became a state, only one governor was chosen by the President of the United States.
Before the territory was officially set up, a local group in Genoa chose Isaac Roop to be a temporary governor. He started his role on December 15, 1859.
| No. | Governor | Term in office | Appointed by | |
|---|---|---|---|---|
| 1 | James W. Nye (1815–1876) |
March 22, 1861 – December 5, 1864 (statehood) |
Abraham Lincoln | |

Governors of the State of Nevada
Nevada officially became a state on October 31, 1864. Since then, there have been thirty-one governors.
The governor who served the longest was Bob Miller. He was governor for two and a half terms, from 1989 to 1999. The shortest-serving governor was Frank Bell. He acted as governor for four months after Governor Charles C. Stevenson passed away.
The current governor is Joe Lombardo, who took office on January 2, 2023.
| No. | Governor | Term in office | Party | Election | Lt. Governor | |||
|---|---|---|---|---|---|---|---|---|
| 1 | Henry G. Blasdel (1825–1900) |
December 5, 1864 – January 2, 1871 (did not run) |
Republican | 1864 | John S. Crosman | |||
| 1866 | James S. Slingerland | |||||||
| 2 | Lewis R. Bradley (1805–1879) |
January 2, 1871 – January 7, 1879 (lost election) |
Democratic | 1870 | Frank Denver | |||
| 1874 | Jewett W. Adams | |||||||
| 3 | John Henry Kinkead (1826–1904) |
January 7, 1879 – January 1, 1883 (did not run) |
Republican | 1878 | ||||
| 4 | Jewett W. Adams (1835–1920) |
January 1, 1883 – January 3, 1887 (lost election) |
Democratic | 1882 | Charles E. Laughton | |||
| 5 | Charles C. Stevenson (1826–1890) |
January 3, 1887 – September 21, 1890 (died in office) |
Republican | 1886 | Henry C. Davis (died) |
|||
| Samuel W. Chubbuck (resigned) |
||||||||
| Frank Bell | ||||||||
| 6 | Frank Bell (1840–1927) |
September 21, 1890 – January 5, 1891 (successor took office) |
Republican | Lieutenant governor acting |
Acting as governor | |||
| 7 | Roswell K. Colcord (1839–1939) |
January 5, 1891 – January 8, 1895 (did not run) |
Republican | 1890 | Joseph Poujade | |||
| 8 | John Edward Jones (1840–1896) |
January 8, 1895 – April 10, 1896 (died in office) |
Silver | 1894 | Reinhold Sadler | |||
| 9 | Reinhold Sadler (1848–1906) |
April 10, 1896 – January 5, 1903 (did not run) |
Silver | Lieutenant governor acting |
Acting as governor | |||
| 1898 | James R. Judge | |||||||
| 10 | John Sparks (1843–1908) |
January 5, 1903 – May 22, 1908 (died in office) |
Silver- Democratic |
1902 | Lemuel Allen | |||
| 1906 | Denver S. Dickerson | |||||||
| 11 | Denver S. Dickerson (1872–1925) |
May 22, 1908 – January 2, 1911 (lost election) |
Silver- Democratic |
Lieutenant governor acting |
Acting as governor | |||
| 12 | Tasker Oddie (1870–1950) |
January 2, 1911 – January 4, 1915 (lost election) |
Republican | 1910 | Gilbert C. Ross | |||
| 13 | Emmet D. Boyle (1879–1926) |
January 4, 1915 – January 1, 1923 (did not run) |
Democratic | 1914 | Maurice J. Sullivan | |||
| 1918 | ||||||||
| 14 | James G. Scrugham (1880–1945) |
January 1, 1923 – January 3, 1927 (lost election) |
Democratic | 1922 | ||||
| 15 | Fred B. Balzar (1880–1934) |
January 3, 1927 – March 21, 1934 (died in office) |
Republican | 1926 | Morley Griswold | |||
| 1930 | ||||||||
| 16 | Morley Griswold (1890–1951) |
March 21, 1934 – January 7, 1935 (lost election) |
Republican | Lieutenant governor acting |
Acting as governor | |||
| 17 | Richard Kirman Sr. (1877–1959) |
January 7, 1935 – January 2, 1939 (did not run) |
Democratic | 1934 | Fred S. Alward | |||
| 18 | Edward P. Carville (1885–1956) |
January 2, 1939 – July 24, 1945 (resigned) |
Democratic | 1938 | Maurice J. Sullivan | |||
| 1942 | Vail Pittman | |||||||
| 19 | Vail Pittman (1880–1964) |
July 24, 1945 – January 2, 1951 (lost election) |
Democratic | Lieutenant governor acting |
Acting as governor | |||
| 1946 | Clifford A. Jones | |||||||
| 20 | Charles H. Russell (1903–1989) |
January 2, 1951 – January 5, 1959 (lost election) |
Republican | 1950 | ||||
| 1954 | Rex Bell (died July 4, 1962) |
|||||||
| 21 | Grant Sawyer (1918–1996) |
January 5, 1959 – January 2, 1967 (lost election) |
Democratic | 1958 | ||||
| Maude Frazier (appointed) |
||||||||
| 1962 | Paul Laxalt | |||||||
| 22 | Paul Laxalt (1922–2018) |
January 2, 1967 – January 4, 1971 (did not run) |
Republican | 1966 | Edward Fike | |||
| 23 | Mike O'Callaghan (1929–2004) |
January 4, 1971 – January 1, 1979 (term-limited) |
Democratic | 1970 | Harry Reid | |||
| 1974 | Robert E. Rose | |||||||
| 24 | Robert List (born in 1936) |
January 1, 1979 – January 3, 1983 (lost election) |
Republican | 1978 | Myron E. Leavitt | |||
| 25 | Richard Bryan (born in 1937) |
January 3, 1983 – January 3, 1989 (resigned) |
Democratic | 1982 | Bob Cashell | |||
| 1986 | Bob Miller | |||||||
| 26 | Bob Miller (born in 1945) |
January 3, 1989 – January 4, 1999 (term-limited) |
Democratic | Lieutenant governor acting |
Acting as governor | |||
| 1990 | Sue Wagner | |||||||
| 1994 | Lonnie Hammargren | |||||||
| 27 | Kenny Guinn (1936–2010) |
January 4, 1999 – January 1, 2007 (term-limited) |
Republican | 1998 | Lorraine Hunt | |||
| 2002 | ||||||||
| 28 | Jim Gibbons (born in 1944) |
January 1, 2007 – January 3, 2011 (lost nomination) |
Republican | 2006 | Brian Krolicki | |||
| 29 | Brian Sandoval (born in 1963) |
January 3, 2011 – January 7, 2019 (term-limited) |
Republican | 2010 | ||||
| 2014 | Mark Hutchison | |||||||
| 30 | Steve Sisolak (born in 1953) |
January 7, 2019 – January 2, 2023 (lost election) |
Democratic | 2018 | Kate Marshall (resigned September 17, 2021) |
|||
| Vacant | ||||||||
| Lisa Cano Burkhead (appointed December 16, 2021) |
||||||||
| 31 | Joe Lombardo (born in 1962) |
January 2, 2023 – Incumbent |
Republican | 2022 | Stavros Anthony | |||


.jpg)


.jpg)
.jpg)
.jpg)
.jpg)
.jpg)
.jpg)

.png)

.jpg)
_(cropped).jpg)
.png)


.jpg)
.jpeg)
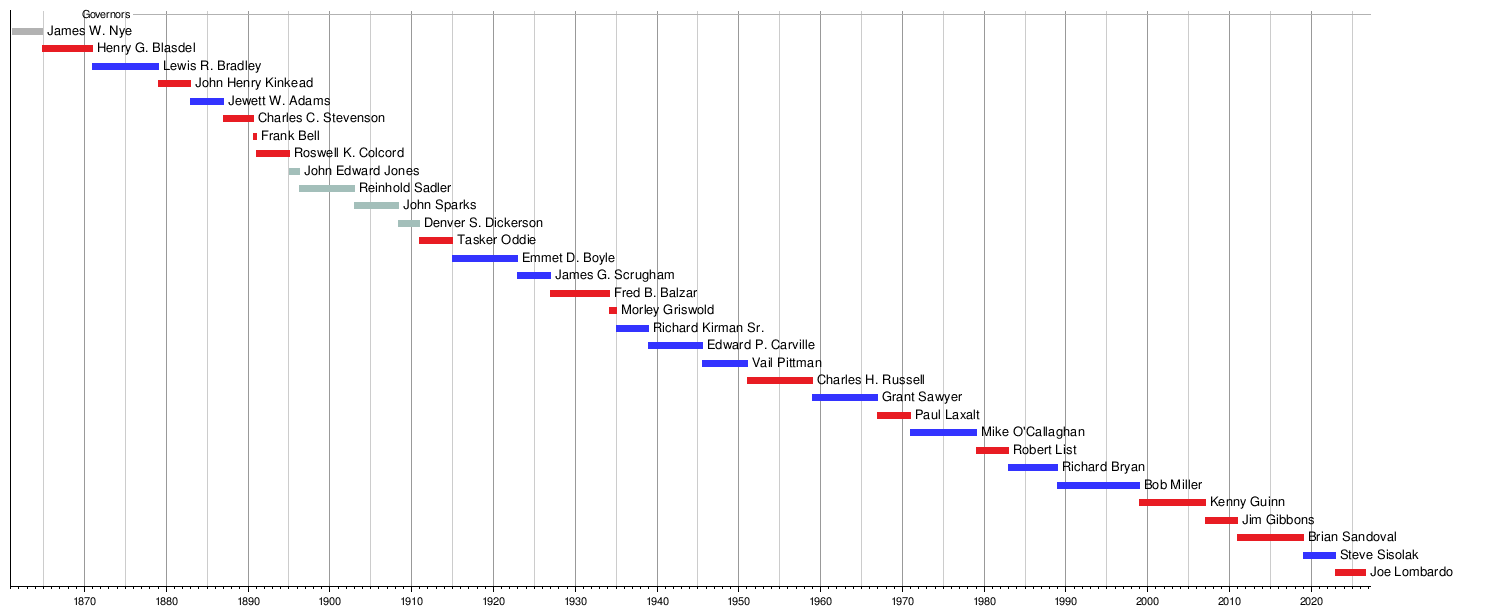
Timeline of Governors
This timeline shows when each governor of Nevada served.
| Timeline of Nevada governors |
 |
See Also
- Gubernatorial lines of succession in the United States#Nevada
