Hamer, Idaho facts for kids
Quick facts for kids
Hamer, Idaho
|
|
|---|---|

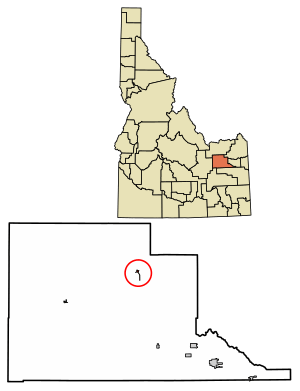
Location of Hamer in Jefferson County, Idaho.
|
|
| Country | United States |
| State | Idaho |
| County | Jefferson |
| Area | |
| • Total | 0.19 sq mi (0.49 km2) |
| • Land | 0.19 sq mi (0.49 km2) |
| • Water | 0.00 sq mi (0.00 km2) |
| Elevation | 4,803 ft (1,464 m) |
| Population
(2010)
|
|
| • Total | 48 |
| • Density | 544.50/sq mi (210.14/km2) |
| Time zone | UTC-7 (Mountain (MST)) |
| • Summer (DST) | UTC-6 (MDT) |
| ZIP code |
83425
|
| Area code(s) | 208 |
| FIPS code | 16-34570 |
| GNIS feature ID | 2410692 |
Hamer is a small community in Jefferson County, Idaho, United States. It is part of the larger Idaho Falls area. Hamer used to be a city, but in 2022, its residents voted to change it back to an unincorporated area. This means it's no longer officially a city. In 2020, about 83 people lived there.
Hamer was named after Thomas Ray Hamer (1864–1950). He was a United States Representative from Idaho. A Representative is someone elected by the people to speak for them in the U.S. government.
Geography of Hamer
Hamer is a very small area of land. According to the United States Census Bureau, it covers about 0.19 square miles (0.49 square kilometers). All of this area is land, with no lakes or rivers within its boundaries.
Climate in Hamer
Hamer has a type of weather called a cold semi-arid climate. This means it's generally dry, but not a desert. It has hot summers and very cold winters. The hottest temperature ever recorded in Hamer was 105°F (41°C) in July 1960 and August 1990. The coldest temperature ever recorded was a very chilly -48°F (-44°C) in January 1979.
| Climate data for Hamer, Idaho, 1991–2020 normals, extremes 1948–present | |||||||||||||
|---|---|---|---|---|---|---|---|---|---|---|---|---|---|
| Month | Jan | Feb | Mar | Apr | May | Jun | Jul | Aug | Sep | Oct | Nov | Dec | Year |
| Record high °F (°C) | 55 (13) |
58 (14) |
74 (23) |
86 (30) |
93 (34) |
102 (39) |
105 (41) |
105 (41) |
99 (37) |
88 (31) |
70 (21) |
60 (16) |
105 (41) |
| Mean maximum °F (°C) | 40.9 (4.9) |
46.3 (7.9) |
63.3 (17.4) |
76.0 (24.4) |
84.3 (29.1) |
90.7 (32.6) |
96.3 (35.7) |
95.5 (35.3) |
89.5 (31.9) |
77.5 (25.3) |
59.5 (15.3) |
44.4 (6.9) |
97.2 (36.2) |
| Mean daily maximum °F (°C) | 29.2 (−1.6) |
35.5 (1.9) |
48.9 (9.4) |
60.4 (15.8) |
70.0 (21.1) |
78.9 (26.1) |
88.7 (31.5) |
87.4 (30.8) |
77.5 (25.3) |
61.6 (16.4) |
43.8 (6.6) |
30.1 (−1.1) |
59.3 (15.2) |
| Daily mean °F (°C) | 18.1 (−7.7) |
23.4 (−4.8) |
35.3 (1.8) |
44.7 (7.1) |
53.6 (12.0) |
61.4 (16.3) |
68.9 (20.5) |
67.3 (19.6) |
58.2 (14.6) |
45.0 (7.2) |
30.5 (−0.8) |
19.6 (−6.9) |
43.8 (6.6) |
| Mean daily minimum °F (°C) | 6.9 (−13.9) |
11.3 (−11.5) |
21.7 (−5.7) |
28.9 (−1.7) |
37.2 (2.9) |
43.9 (6.6) |
49.2 (9.6) |
47.1 (8.4) |
38.9 (3.8) |
28.4 (−2.0) |
17.3 (−8.2) |
9.2 (−12.7) |
28.3 (−2.0) |
| Mean minimum °F (°C) | −17.9 (−27.7) |
−11.6 (−24.2) |
3.3 (−15.9) |
13.6 (−10.2) |
22.8 (−5.1) |
31.0 (−0.6) |
38.5 (3.6) |
35.8 (2.1) |
25.2 (−3.8) |
11.6 (−11.3) |
−2.5 (−19.2) |
−15.1 (−26.2) |
−23.0 (−30.6) |
| Record low °F (°C) | −48 (−44) |
−46 (−43) |
−27 (−33) |
1 (−17) |
14 (−10) |
25 (−4) |
28 (−2) |
20 (−7) |
8 (−13) |
−8 (−22) |
−38 (−39) |
−40 (−40) |
−48 (−44) |
| Average precipitation inches (mm) | 0.72 (18) |
0.44 (11) |
0.50 (13) |
0.94 (24) |
1.47 (37) |
1.11 (28) |
0.52 (13) |
0.51 (13) |
0.63 (16) |
0.73 (19) |
0.56 (14) |
0.80 (20) |
8.93 (226) |
| Average snowfall inches (cm) | 5.8 (15) |
3.5 (8.9) |
1.7 (4.3) |
0.8 (2.0) |
0.0 (0.0) |
0.0 (0.0) |
0.0 (0.0) |
0.0 (0.0) |
0.0 (0.0) |
0.1 (0.25) |
1.7 (4.3) |
6.8 (17) |
20.4 (51.75) |
| Average precipitation days (≥ 0.01 in) | 6.3 | 4.9 | 4.0 | 6.3 | 7.3 | 5.9 | 3.5 | 3.7 | 3.9 | 4.3 | 4.5 | 6.4 | 61.0 |
| Average snowy days (≥ 0.1 in) | 5.0 | 3.3 | 0.8 | 0.4 | 0.0 | 0.0 | 0.0 | 0.0 | 0.0 | 0.2 | 1.7 | 4.7 | 16.1 |
| Source 1: NOAA | |||||||||||||
| Source 2: National Weather Service | |||||||||||||
People of Hamer
Demographics is the study of how people are counted and described in a place. This includes things like how many people live there, their ages, and their family situations.
| Historical population | |||
|---|---|---|---|
| Census | Pop. | %± | |
| 1960 | 144 | — | |
| 1970 | 81 | −43.7% | |
| 1980 | 93 | 14.8% | |
| 1990 | 79 | −15.1% | |
| 2000 | 12 | −84.8% | |
| 2010 | 48 | 300.0% | |
| 2019 (est.) | 104 | 116.7% | |
| U.S. Decennial Census | |||
Hamer Population in 2010
In 2010, the census counted 48 people living in Hamer. These people lived in 13 different homes, and 10 of those were families.
- Most people (about 73%) were White.
- A smaller group (about 6%) were Asian.
- About 21% of the people were from two or more different racial backgrounds.
- About 12.5% of the people identified as Hispanic or Latino.
In the 13 homes:
- Almost half (46.2%) had children under 18 living there.
- Most (69.2%) were married couples living together.
- One home (7.7%) had a female head of the house with no husband present.
- About 23% of homes were not families, meaning individuals lived alone or with roommates.
- About 15% of homes had someone 65 years or older living alone.
The average age of people in Hamer was 22 years old.
- Almost half (47.9%) of the residents were under 18.
- A small group (2.2%) were between 18 and 24.
- About 15% were between 25 and 44.
- About 19% were between 45 and 64.
- About 17% were 65 years or older.
When it came to gender, about 48% of the people were male, and about 52% were female.
See also
 In Spanish: Hamer (Idaho) para niños
 | Anna J. Cooper |
 | Mary McLeod Bethune |
 | Lillie Mae Bradford |

