Hilmar-Irwin, California facts for kids
Quick facts for kids
Hilmar-Irwin, California
|
|
|---|---|
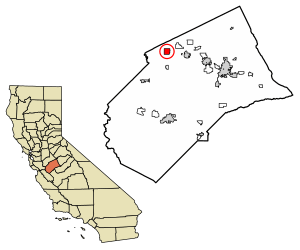
Location in Merced County, California
|
|
| Country | |
| State | |
| County | Merced |
| Area | |
| • Total | 3.928 sq mi (10.173 km2) |
| • Land | 3.928 sq mi (10.173 km2) |
| • Water | 0 sq mi (0 km2) 0% |
| Population
(2020)
|
|
| • Total | 5,164 |
| • Density | 1,314.66/sq mi (507.62/km2) |
| Time zone | UTC-8 (Pacific (PST)) |
| • Summer (DST) | UTC-7 (PDT) |
| ZIP code |
95324 (Hilmar)
|
| Area code(s) | 209 |
| FIPS code | 06-33861 |
Hilmar-Irwin is a community in Merced County, California, United States. It is known as a census-designated place (CDP). This means it's a special area defined by the U.S. Census Bureau for collecting population data. In 2020, about 5,164 people lived there.
Contents
Where is Hilmar-Irwin?
Hilmar-Irwin is located in the northern part of Merced County. It's about 6 miles (9.7 km) west of Delhi. It is also about 8 miles (12.9 km) west of Livingston. The town of Turlock is about 6 miles (9.7 km) to the north.
The area of Hilmar-Irwin covers about 3.9 square miles (10.1 square kilometers). All of this area is land.
What's in Hilmar-Irwin?
Hilmar-Irwin is home to the famous Hilmar Cheese Company. This company makes a lot of cheese! They even offer tours for people to see how cheese is made.
What's the Weather Like?
Hilmar-Irwin has hot, mostly dry summers. The winters are cool and wet. In January, the average high temperature is about 54°F (12°C). The average low temperature is about 40°F (4°C).
| Climate data for Hilmar | |||||||||||||
|---|---|---|---|---|---|---|---|---|---|---|---|---|---|
| Month | Jan | Feb | Mar | Apr | May | Jun | Jul | Aug | Sep | Oct | Nov | Dec | Year |
| Record high °F (°C) | 75 (24) |
78 (26) |
87 (31) |
96 (36) |
102 (39) |
111 (44) |
114 (46) |
113 (45) |
105 (41) |
98 (37) |
84 (29) |
72 (22) |
114 (46) |
| Mean daily maximum °F (°C) | 54 (12) |
61 (16) |
67 (19) |
73 (23) |
81 (27) |
88 (31) |
94 (34) |
92 (33) |
87 (31) |
77 (25) |
64 (18) |
54 (12) |
74 (23) |
| Daily mean °F (°C) | 47.5 (8.6) |
52 (11) |
57 (14) |
61.5 (16.4) |
68 (20) |
74 (23) |
78.5 (25.8) |
77 (25) |
73.5 (23.1) |
65.5 (18.6) |
54.5 (12.5) |
46.5 (8.1) |
63.0 (17.2) |
| Mean daily minimum °F (°C) | 40 (4) |
43 (6) |
46 (8) |
49 (9) |
55 (13) |
60 (16) |
63 (17) |
62 (17) |
59 (15) |
53 (12) |
44 (7) |
39 (4) |
51 (11) |
| Record low °F (°C) | 18 (−8) |
21 (−6) |
25 (−4) |
28 (−2) |
34 (1) |
40 (4) |
43 (6) |
41 (5) |
37 (3) |
32 (0) |
22 (−6) |
3 (−16) |
3 (−16) |
| Average rainfall inches (mm) | 2.47 (63) |
2.36 (60) |
1.93 (49) |
0.87 (22) |
0.52 (13) |
0.06 (1.5) |
0 (0) |
0.01 (0.25) |
0.25 (6.4) |
0.68 (17) |
1.32 (34) |
2.03 (52) |
12.5 (318.15) |
Who Lives in Hilmar-Irwin?
The population of Hilmar-Irwin has changed over the years.
| Historical population | |||
|---|---|---|---|
| Census | Pop. | %± | |
| 1990 | 3,278 | — | |
| 2000 | 4,807 | 46.6% | |
| 2010 | 5,197 | 8.1% | |
| 2020 | 5,164 | −0.6% | |
| U.S. Decennial Census | |||
Population in 2010
In 2010, Hilmar-Irwin had 5,197 people. Most people lived in family homes. About 26.7% of the population was under 18 years old. About 13.7% of the people were 65 years or older.
The community was mostly White (86.1%). About 17.6% of the people were of Hispanic or Latino background.
Population in 2000
In 2000, there were 4,807 people living in Hilmar-Irwin. About 29% of the population was under 18 years old. About 13.2% of the people were 65 years or older.
The main racial group was White (77.93%). About 12.38% of the population was Hispanic or Latino.
Population in 1990
In 1990, the population of Hilmar-Irwin was 3,278 people. Most residents were White (92.2%). About 11.1% of the population was Hispanic or Latino.
See also
 In Spanish: Hilmar-Irwin para niños
 | Mary Eliza Mahoney |
 | Susie King Taylor |
 | Ida Gray |
 | Eliza Ann Grier |


