Kobuk, Alaska facts for kids
Quick facts for kids
Kobuk
Laugviik
|
|
|---|---|

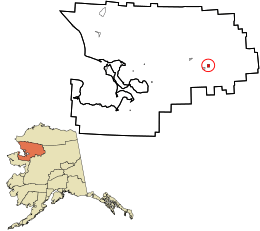
Location in Northwest Arctic Borough and the state of Alaska.
|
|
| Country | United States |
| State | Alaska |
| Borough | Northwest Arctic |
| Incorporated | September 25, 1973 |
| Area | |
| • Total | 16.02 sq mi (41.49 km2) |
| • Land | 15.51 sq mi (40.16 km2) |
| • Water | 0.51 sq mi (1.33 km2) |
| Elevation | 148 ft (45 m) |
| Population
(2020)
|
|
| • Total | 191 |
| • Density | 12.32/sq mi (4.76/km2) |
| Time zone | UTC-9 (Alaska (AKST)) |
| • Summer (DST) | UTC-8 (AKDT) |
| ZIP code |
99751
|
| Area code | 907 |
| FIPS code | 02-40840 |
| GNIS feature ID | 1413362 |
Kobuk (which is called Laugviik in the local Inupiaq language) is a small city in Northwest Arctic Borough, Alaska, United States. In 2010, about 151 people lived there. By 2020, the population grew to 191.
Contents
History of Kobuk
Kobuk started in 1899. It was first known as the village of Shungnak. This village was a place where miners could get supplies. These miners worked north of the Kobuk River in the Cosmos Hills.
Early Settlement and Relocation
Over time, a trading post, a school, and a mission were built in Shungnak. More people came to live in the settlement. But in the 1920s, the river began to wear away the land. This erosion made many people move. They went about 10 miles (16 km) downstream to a new spot called "Kochuk."
Kochuk became the new village of Shungnak. The original Shungnak village was then renamed Kobuk in 1928.
Major Flood and City Incorporation
In May 1973, a big flood covered the entire village of Kobuk. Later that year, in September, Kobuk officially became a city.
Economy and First Postmaster
The people of Kobuk mostly rely on hunting. They hunt animals like caribou and moose for food. The first postmaster in Kobuk, when it was still called Shungnak, was Martin F. Moran. He started his job on September 24, 1903.
Geography and Climate of Kobuk
Kobuk is located in a very cold part of the world. It has a subarctic climate. This means it has long, very cold winters and short, cool summers.
Location and Nearby Areas
Kobuk is found at 66°55′3″N 156°54′25″W / 66.91750°N 156.90694°W. It sits right on the bank of the Kobuk River. It is about 10 kilometers (6.2 mi) northeast of another city called Shungnak. Kobuk is also close to Kobuk Valley National Park, a beautiful natural area.
Land and Water Area
The city of Kobuk covers a total area of about 16.8 square miles (43.5 square kilometers). Most of this area, about 16.1 square miles (41.7 square kilometers), is land. The rest, about 0.7 square miles (1.8 square kilometers), is water.
Record Cold Temperature
Kobuk is known for its extreme cold. The coldest temperature ever recorded in Kobuk was -68°F (-56°C). This happened on March 1, 1971. This temperature is the coldest ever recorded in the United States during the month of March!
| Climate data for Kobuk (1961–1990 normals, extremes 1953–1979) | |||||||||||||
|---|---|---|---|---|---|---|---|---|---|---|---|---|---|
| Month | Jan | Feb | Mar | Apr | May | Jun | Jul | Aug | Sep | Oct | Nov | Dec | Year |
| Record high °F (°C) | 39 (4) |
38 (3) |
45 (7) |
59 (15) |
79 (26) |
90 (32) |
92 (33) |
90 (32) |
73 (23) |
55 (13) |
42 (6) |
40 (4) |
92 (33) |
| Mean maximum °F (°C) | 29.3 (−1.5) |
26.4 (−3.1) |
33.8 (1.0) |
46.6 (8.1) |
66.3 (19.1) |
79.3 (26.3) |
81.8 (27.7) |
78.7 (25.9) |
66.3 (19.1) |
43.3 (6.3) |
32.8 (0.4) |
29.0 (−1.7) |
84.3 (29.1) |
| Mean daily maximum °F (°C) | 1.1 (−17.2) |
3.1 (−16.1) |
13.4 (−10.3) |
29.1 (−1.6) |
49.8 (9.9) |
65.5 (18.6) |
68.8 (20.4) |
64.1 (17.8) |
51.4 (10.8) |
28.8 (−1.8) |
11.2 (−11.6) |
1.7 (−16.8) |
32.4 (0.2) |
| Daily mean °F (°C) | −7.3 (−21.8) |
−9.5 (−23.1) |
−0.1 (−17.8) |
16.0 (−8.9) |
39.2 (4.0) |
54.1 (12.3) |
57.6 (14.2) |
53.7 (12.1) |
42.2 (5.7) |
19.9 (−6.7) |
3.7 (−15.7) |
−9.3 (−22.9) |
21.7 (−5.7) |
| Mean daily minimum °F (°C) | −18.7 (−28.2) |
−20.4 (−29.1) |
−12.2 (−24.6) |
5.3 (−14.8) |
27.0 (−2.8) |
41.6 (5.3) |
45.1 (7.3) |
42.3 (5.7) |
32.1 (0.1) |
11.8 (−11.2) |
−6.0 (−21.1) |
−18.4 (−28.0) |
10.9 (−11.7) |
| Mean minimum °F (°C) | −53.6 (−47.6) |
−55.1 (−48.4) |
−48.4 (−44.7) |
−31.2 (−35.1) |
11.6 (−11.3) |
29.3 (−1.5) |
34.1 (1.2) |
26.7 (−2.9) |
12.0 (−11.1) |
−18.8 (−28.2) |
−35.8 (−37.7) |
−51.8 (−46.6) |
−58.1 (−50.1) |
| Record low °F (°C) | −65 (−54) |
−65 (−54) |
−68 (−56) |
−41 (−41) |
−16 (−27) |
19 (−7) |
29 (−2) |
19 (−7) |
−5 (−21) |
−42 (−41) |
−59 (−51) |
−60 (−51) |
−68 (−56) |
| Average precipitation inches (mm) | 0.54 (14) |
0.42 (11) |
0.55 (14) |
0.66 (17) |
0.85 (22) |
1.78 (45) |
3.11 (79) |
3.42 (87) |
2.67 (68) |
1.05 (27) |
0.95 (24) |
0.69 (18) |
16.69 (424) |
| Average snowfall inches (cm) | 6.8 (17) |
4.4 (11) |
6.1 (15) |
4.7 (12) |
0.7 (1.8) |
0.1 (0.25) |
0.0 (0.0) |
0.0 (0.0) |
1.9 (4.8) |
6.9 (18) |
11.7 (30) |
7.6 (19) |
50.9 (129) |
| Average precipitation days (≥ 0.01 inch) | 5.1 | 3.4 | 4.8 | 5.9 | 5.3 | 8.6 | 11.2 | 14.1 | 11.2 | 7.1 | 7.8 | 6.2 | 90.7 |
| Average snowy days (≥ 0.1 inch) | 3.8 | 2.6 | 4.0 | 3.5 | 0.6 | 0.1 | 0.0 | 0.0 | 1.0 | 3.7 | 6.3 | 4.5 | 30.1 |
| Source 1: WRCC | |||||||||||||
| Source 2: XMACIS (snowfall) | |||||||||||||
People of Kobuk: Demographics
| Historical population | |||
|---|---|---|---|
| Census | Pop. | %± | |
| 1910 | 210 | — | |
| 1920 | 95 | −54.8% | |
| 1940 | 31 | — | |
| 1950 | 38 | 22.6% | |
| 1960 | 54 | 42.1% | |
| 1970 | 56 | 3.7% | |
| 1980 | 62 | 10.7% | |
| 1990 | 69 | 11.3% | |
| 2000 | 109 | 58.0% | |
| 2010 | 151 | 38.5% | |
| 2020 | 191 | 26.5% | |
| U.S. Decennial Census | |||
Kobuk's population has changed a lot over the years. It first appeared on the U.S. Census in 1910. Back then, it was called Shungnak.
Population Changes Over Time
After many people moved to the new Shungnak site in 1927, the old village was renamed Kobuk in 1928. It wasn't on the census in 1930. But it has been listed again since 1940. In 1973, Kobuk officially became a city.
Population in 2000
In the year 2000, there were 109 people living in Kobuk. These people made up 26 households and 23 families. The average household had about 4 people.
Most of the people in Kobuk were Native American (93.58%). A small number were White (4.59%) or Asian (0.92%).
Age and Income
In 2000, a large part of the population was young. About 52.3% of the people were under 18 years old. The average age was 17 years.
The average income for a household in Kobuk was $30,750 per year. For families, it was $20,313. Some families and people lived below the poverty line. This included 28.2% of those under 18.
Education in Kobuk
The children in Kobuk go to the Kobuk School. This school is run by the Northwest Arctic Borough School District. As of 2017, there were 44 students attending the school. All of the students were Alaska Natives.
See also
 In Spanish: Kobuk (Alaska) para niños
 | Madam C. J. Walker |
 | Janet Emerson Bashen |
 | Annie Turnbo Malone |
 | Maggie L. Walker |

