Lawrenceville, Pennsylvania facts for kids
Quick facts for kids
Lawrenceville, Pennsylvania
|
||
|---|---|---|
|
Borough
|
||
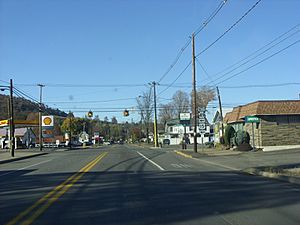
Looking north on Main Street in Lawrenceville
|
||
|
||
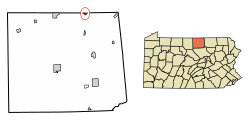
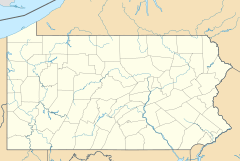
Location of Lawrenceville in Tioga County, Pennsylvania.
|
||
| Country | United States | |
| State | Pennsylvania | |
| County | Tioga | |
| Settled | 1793 | |
| Incorporated (borough) | 1831 | |
| Area | ||
| • Total | 0.61 sq mi (1.59 km2) | |
| • Land | 0.61 sq mi (1.59 km2) | |
| • Water | 0.00 sq mi (0.00 km2) | |
| Elevation | 997 ft (304 m) | |
| Population
(2020)
|
||
| • Total | 691 | |
| • Density | 1,123.58/sq mi (434.13/km2) | |
| Time zone | Eastern (EST) | |
| • Summer (DST) | EDT | |
| ZIP Code |
16929
|
|
| Area code(s) | 570 | |
| FIPS code | 42-42016 | |
Lawrenceville is a small town, also known as a borough, located in Tioga County, Pennsylvania. It's a cozy community where the population was about 690 people in 2020. This town is a great example of a quiet place in the United States.
Contents
Exploring Lawrenceville's Location
Lawrenceville is found at 41°59′48″N 77°7′31″W / 41.99667°N 77.12528°W. It sits right where two important roads meet: Pennsylvania Route 287 and Pennsylvania Route 49. You'll know you're there because this intersection has the only traffic light in the whole town!
Rivers and Lakes Near Lawrenceville
The town is built along the banks of two rivers, the Tioga and the Cowanesque. These two rivers actually join together just outside the main part of Lawrenceville.
Not far from town, to the west, you'll find Cowanesque Lake. This lake was created by the US Army Corps of Engineers. Its main job is to help prevent floods in the area.
Lawrenceville's Size and Borders
According to the U.S. Census Bureau, Lawrenceville covers an area of about 0.6 square miles (1.6 km2). All of this area is land. The community is very close to the border of New York state. In fact, some parts of Lawrenceville's development even extend into the town of Lindley in Steuben County, New York.
Who Lives in Lawrenceville?
Lawrenceville has seen its population change over many years. Here's a quick look at how many people have lived there:
| Historical population | |||
|---|---|---|---|
| Census | Pop. | %± | |
| 1850 | 494 | — | |
| 1860 | 512 | 3.6% | |
| 1870 | 478 | −6.6% | |
| 1880 | 426 | −10.9% | |
| 1890 | 441 | 3.5% | |
| 1900 | 486 | 10.2% | |
| 1910 | 549 | 13.0% | |
| 1920 | 508 | −7.5% | |
| 1930 | 457 | −10.0% | |
| 1940 | 450 | −1.5% | |
| 1950 | 479 | 6.4% | |
| 1960 | 548 | 14.4% | |
| 1970 | 605 | 10.4% | |
| 1980 | 327 | −46.0% | |
| 1990 | 481 | 47.1% | |
| 2000 | 627 | 30.4% | |
| 2010 | 581 | −7.3% | |
| 2020 | 690 | 18.8% | |
| 2021 (est.) | 689 | 18.6% | |
| Sources: | |||
Population Details from 2000
In the year 2000, there were 627 people living in Lawrenceville. Most of the people living there were White. A small number of residents were African American, Native American, or Asian.
About one-third of the households in Lawrenceville had children under 18 living with them. The average age of people in the borough was 37 years old. This means there was a good mix of younger and older people.
See also
 In Spanish: Lawrenceville (Pensilvania) para niños
 | Dorothy Vaughan |
 | Charles Henry Turner |
 | Hildrus Poindexter |
 | Henry Cecil McBay |


