Linwood, Nebraska facts for kids
Quick facts for kids
Linwood, Nebraska
|
|
|---|---|
|
Village
|
|
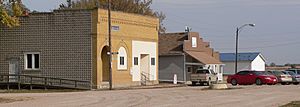
Downtown Linwood
|
|
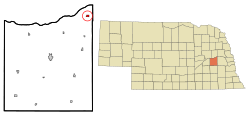
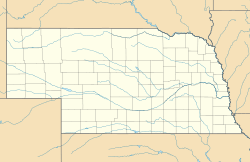
Location of Linwood, Nebraska
|
|
| Country | United States |
| State | Nebraska |
| County | Butler |
| Township | Platte |
| Area | |
| • Total | 0.38 sq mi (0.98 km2) |
| • Land | 0.38 sq mi (0.98 km2) |
| • Water | 0.00 sq mi (0.00 km2) |
| Elevation | 1,335 ft (407 m) |
| Population
(2020)
|
|
| • Total | 94 |
| • Density | 248.02/sq mi (95.87/km2) |
| Time zone | UTC-6 (Central (CST)) |
| • Summer (DST) | UTC-5 (CDT) |
| ZIP code |
68036
|
| Area code(s) | 402 |
| FIPS code | 31-28245 |
| GNIS feature ID | 2398447 |
| Website | villageoflinwood.com |
Linwood is a small village located in Butler County, Nebraska, in the United States. It is a quiet community with a rich history. In 2020, the village had a population of 94 people.
Contents
History of Linwood Village
People first tried to settle in the Linwood area in 1857. This early settlement was on the banks of Skull Creek. A school was opened in 1865, helping the community grow. In 1868, a post office was set up, and the settlement was first called Skull Creek.
The village was later renamed Linwood. This new name came from the linden trees that grew near the creek. Linwood officially became a village in 1888. This happened soon after the Fremont, Elkhorn and Missouri Valley Railroad built a train line through the area.
Linwood was an important spot for trains. It served as a junction where different rail lines met. These lines went to other towns like Superior and Hastings. However, these train lines were no longer used by the early 1960s. This meant Linwood lost its train service. In 1963, a big flood caused a lot of damage to the community.
Geography of Linwood
Linwood is a small village in terms of its size. According to the United States Census Bureau, the total area of the village is about 0.37 square miles (0.98 square kilometers). All of this area is land, meaning there are no large bodies of water within the village limits.
Linwood's Population Changes
The number of people living in Linwood has changed over many years. Here is a look at how the population has grown and shrunk since 1890:
| Historical population | |||
|---|---|---|---|
| Census | Pop. | %± | |
| 1890 | 309 | — | |
| 1900 | 317 | 2.6% | |
| 1910 | 329 | 3.8% | |
| 1920 | 297 | −9.7% | |
| 1930 | 235 | −20.9% | |
| 1940 | 247 | 5.1% | |
| 1950 | 168 | −32.0% | |
| 1960 | 151 | −10.1% | |
| 1970 | 108 | −28.5% | |
| 1980 | 119 | 10.2% | |
| 1990 | 91 | −23.5% | |
| 2000 | 118 | 29.7% | |
| 2010 | 88 | −25.4% | |
| 2020 | 94 | 6.8% | |
| U.S. Decennial Census | |||
Linwood's Population in 2010
In 2010, a census was taken to count the people in Linwood. At that time, there were 88 people living in the village. These people lived in 38 different homes, called households. Out of these, 21 were families.
The village had a population density of about 237.8 people per square mile. This means that, on average, about 238 people lived in every square mile of the village. There were also 50 housing units available.
Most of the people in Linwood were White, making up 94.3% of the population. A small number were Native American (2.3%). About 3.4% of the people were from two or more racial backgrounds. Some residents, 5.7%, identified as Hispanic or Latino.
Linwood Households and Ages
Out of the 38 households in Linwood in 2010, about 31.6% had children under 18 living there. Many homes (34.2%) were married couples living together. Some homes had a female head of the house without a husband (13.2%). A few had a male head of the house without a wife (7.9%). About 44.7% of households were not families.
Roughly 31.6% of all households had only one person living in them. About 10.5% of these single-person homes were people aged 65 or older. On average, each household had 2.32 people. The average family size was 3.00 people.
The median age in Linwood was 31.5 years old. This means half the people were younger than 31.5 and half were older. About 29.5% of residents were under 18 years old. About 10.3% were between 18 and 24. People aged 25 to 44 made up 21.6% of the population. Those aged 45 to 64 were 26.1%. Finally, 12.5% of the residents were 65 years old or older. In terms of gender, 55.7% of the population was male, and 44.3% was female.
See also
 In Spanish: Linwood (Nebraska) para niños
 | Shirley Ann Jackson |
 | Garett Morgan |
 | J. Ernest Wilkins Jr. |
 | Elijah McCoy |


