Lowell, Oregon facts for kids
Quick facts for kids
Lowell, Oregon
|
|
|---|---|

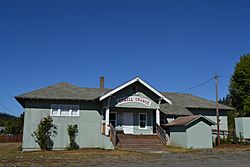
The Lowell Grange
|
|

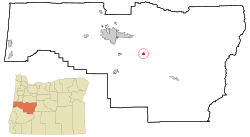
Location in Oregon
|
|
| Country | United States |
| State | Oregon |
| County | Lane |
| Incorporated | 1954 |
| Area | |
| • Total | 1.18 sq mi (3.06 km2) |
| • Land | 0.86 sq mi (2.24 km2) |
| • Water | 0.32 sq mi (0.82 km2) |
| Elevation | 748 ft (228 m) |
| Population
(2020)
|
|
| • Total | 1,196 |
| • Density | 1,382.66/sq mi (533.68/km2) |
| Time zone | UTC-8 (Pacific) |
| • Summer (DST) | UTC-7 (Pacific) |
| ZIP code |
97452
|
| Area code(s) | 541 and 458 |
| FIPS code | 41-44050 |
| GNIS feature ID | 2410889 |
| Website | www.ci.lowell.or.us |
Lowell is a city located in Lane County, in the state of Oregon. In 2010, the city had a population of 1,045 people. By 2020, the population grew to 1,196.
The city sits on the north side of Dexter Reservoir, which is part of the Middle Fork Willamette River. A common way to reach Lowell is by crossing the Lowell Bridge. This is a special covered bridge that goes over the reservoir from Oregon Route 58.
Contents
History of Lowell
A post office in Lowell started operating in 1883. The city was named after another place called Lowell, Maine.
Geography and Surroundings
Lowell covers a total area of about 1.19 square miles (3.06 square kilometers). Most of this area, about 0.86 square miles (2.24 square kilometers), is land. The rest, about 0.32 square miles (0.82 square kilometers), is water.
The town of Lowell is surrounded by three large reservoirs: Dexter, Lookout Point, and Fall Creek. Because of these lakes, Lowell is a popular spot for outdoor activities. Many people from nearby cities like Eugene and Springfield visit Lowell for recreation.
Lowell's Climate
The weather in Lowell is a bit different from Eugene, which is at a lower elevation. Lowell gets about 8 inches (20 cm) more rain each year than Eugene. It also gets about 2 inches (5 mm) more snow. This small amount of snow is quite noticeable for central Lane County, where heavy snow is rare.
Higher parts of Lowell receive even more rain and snow. Because it's surrounded by three reservoirs, Lowell often has thick fog during the winter months.
| Climate data for Lookout Point Dam, Oregon (1991–2020 normals, extremes 1969–present) | |||||||||||||
|---|---|---|---|---|---|---|---|---|---|---|---|---|---|
| Month | Jan | Feb | Mar | Apr | May | Jun | Jul | Aug | Sep | Oct | Nov | Dec | Year |
| Record high °F (°C) | 71 (22) |
73 (23) |
79 (26) |
85 (29) |
93 (34) |
111 (44) |
102 (39) |
106 (41) |
101 (38) |
89 (32) |
74 (23) |
72 (22) |
111 (44) |
| Mean maximum °F (°C) | 60.5 (15.8) |
63.1 (17.3) |
70.3 (21.3) |
76.0 (24.4) |
82.6 (28.1) |
87.2 (30.7) |
93.1 (33.9) |
93.0 (33.9) |
89.2 (31.8) |
77.5 (25.3) |
66.1 (18.9) |
60.7 (15.9) |
95.9 (35.5) |
| Mean daily maximum °F (°C) | 46.9 (8.3) |
50.3 (10.2) |
54.2 (12.3) |
58.5 (14.7) |
64.9 (18.3) |
70.8 (21.6) |
79.8 (26.6) |
80.0 (26.7) |
74.2 (23.4) |
62.8 (17.1) |
52.0 (11.1) |
46.0 (7.8) |
61.7 (16.5) |
| Daily mean °F (°C) | 42.0 (5.6) |
44.1 (6.7) |
47.0 (8.3) |
50.5 (10.3) |
55.8 (13.2) |
60.8 (16.0) |
67.2 (19.6) |
67.3 (19.6) |
63.2 (17.3) |
55.0 (12.8) |
46.7 (8.2) |
41.5 (5.3) |
53.4 (11.9) |
| Mean daily minimum °F (°C) | 37.1 (2.8) |
37.8 (3.2) |
39.8 (4.3) |
42.5 (5.8) |
46.7 (8.2) |
50.7 (10.4) |
54.7 (12.6) |
54.5 (12.5) |
52.2 (11.2) |
47.2 (8.4) |
41.5 (5.3) |
36.9 (2.7) |
45.1 (7.3) |
| Mean minimum °F (°C) | 26.5 (−3.1) |
28.4 (−2.0) |
31.5 (−0.3) |
34.8 (1.6) |
37.0 (2.8) |
42.9 (6.1) |
47.5 (8.6) |
47.3 (8.5) |
43.9 (6.6) |
37.2 (2.9) |
31.0 (−0.6) |
26.2 (−3.2) |
21.9 (−5.6) |
| Record low °F (°C) | 6 (−14) |
7 (−14) |
22 (−6) |
28 (−2) |
30 (−1) |
36 (2) |
40 (4) |
39 (4) |
33 (1) |
26 (−3) |
16 (−9) |
3 (−16) |
3 (−16) |
| Average precipitation inches (mm) | 6.06 (154) |
4.64 (118) |
5.14 (131) |
4.83 (123) |
3.52 (89) |
2.04 (52) |
0.51 (13) |
0.56 (14) |
1.63 (41) |
3.65 (93) |
6.41 (163) |
7.04 (179) |
46.03 (1,169) |
| Average snowfall inches (cm) | 0.4 (1.0) |
0.2 (0.51) |
0.0 (0.0) |
0.0 (0.0) |
0.0 (0.0) |
0.0 (0.0) |
0.0 (0.0) |
0.0 (0.0) |
0.0 (0.0) |
0.0 (0.0) |
0.0 (0.0) |
0.0 (0.0) |
0.6 (1.5) |
| Average precipitation days (≥ 0.01 in) | 19.3 | 17.0 | 19.4 | 18.6 | 13.6 | 9.2 | 3.4 | 3.7 | 6.5 | 13.1 | 18.6 | 19.8 | 162.2 |
| Average snowy days (≥ 0.1 in) | 0.1 | 0.1 | 0.0 | 0.0 | 0.0 | 0.0 | 0.0 | 0.0 | 0.0 | 0.0 | 0.0 | 0.0 | 0.2 |
| Source: NOAA | |||||||||||||
Population and People
| Historical population | |||
|---|---|---|---|
| Census | Pop. | %± | |
| 1960 | 503 | — | |
| 1970 | 567 | 12.7% | |
| 1980 | 661 | 16.6% | |
| 1990 | 785 | 18.8% | |
| 2000 | 857 | 9.2% | |
| 2010 | 1,045 | 21.9% | |
| 2020 | 1,196 | 14.4% | |
| U.S. Decennial Census | |||
2010 Census Information
In 2010, there were 1,045 people living in Lowell. These people lived in 397 households, and 298 of these were families. The city had about 1,201 people per square mile (463.7 per square kilometer).
Most of the people in Lowell (90.9%) were White. Other groups included:
- 1.7% Native American
- 0.7% Asian
- 0.7% from other backgrounds
- 6.0% from two or more backgrounds
About 3.5% of the population identified as Hispanic or Latino.
Households and Families
Out of the 397 households:
- 35.8% had children under 18 living with them.
- 58.9% were married couples living together.
- 10.1% had a female head of household with no husband present.
- 6.0% had a male head of household with no wife present.
- 24.9% were not families.
About 19.1% of all households were made up of individuals living alone. Only 3.3% had someone aged 65 or older living by themselves. The average household had 2.63 people, and the average family had 2.97 people.
The average age of people in Lowell was 39 years old.
- 27.5% of residents were under 18.
- 4% were between 18 and 24.
- 26.8% were between 25 and 44.
- 32.7% were between 45 and 64.
- 9.1% were 65 years or older.
The city's population was almost evenly split between genders, with 50.8% male and 49.2% female.
See also
 In Spanish: Lowell (Oregón) para niños
 | William L. Dawson |
 | W. E. B. Du Bois |
 | Harry Belafonte |

