Maullín facts for kids
Quick facts for kids
Maullín
|
||||||
|---|---|---|---|---|---|---|
|
Town and Commune
|
||||||
|
||||||
| Country | Chile | |||||
| Region | Los Lagos | |||||
| Province | Llanquihue | |||||
| Government | ||||||
| • Type | Municipality | |||||
| Area | ||||||
| • Total | 860.8 km2 (332.4 sq mi) | |||||
| Elevation | 17 m (56 ft) | |||||
| Population
(2002)
|
||||||
| • Total | 15,580 | |||||
| • Density | 18.099/km2 (46.877/sq mi) | |||||
| • Urban | 6,896 | |||||
| • Rural | 8,684 | |||||
| Sex | ||||||
| • Men | 8,146 | |||||
| • Women | 7,434 | |||||
| Time zone | UTC-4 (CLT) | |||||
| • Summer (DST) | UTC-3 (CLST) | |||||
| Area code(s) | 56 + 65 | |||||
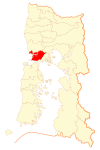
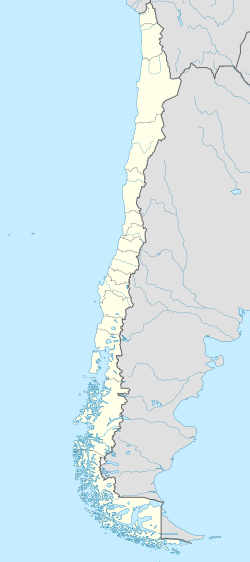
Maullín is a town and a special area called a commune in Chile. It's located in the Llanquihue Province, which is part of the Los Lagos Region. The town sits right where the Maullín River flows out.
Contents
History of Maullín
Early Days and Fort Building
Way back in 1674, a group of soldiers from the Basque region of Spain were stationed where Maullín is today. Their job was to spot any attacks from enemies, especially the Dutch and English. These enemies often tried to enter Chile by sailing around Cape Horn.
Later, in 1787, a fort in Maullín was rebuilt by a military leader named Colonel Francisco Hurtado. This shows how important the location was for protecting the area.
Becoming a Municipality
After many years, on September 15, 1882, Maullín was officially recognized as a municipality. This meant it could have its own local government.
Changes in Trade and Industry
For a long time, Maullín was a busy place for trade and business. However, things changed when more factories started to appear and when the Panama Canal opened. The Panama Canal made it easier for large ships to bring goods from Europe directly to other places, which affected Maullín's economy.
In the early 1900s, Maullín was known for its wood industry. There were many sawmills and docks along the river. Large amounts of timber were shipped from here. But over time, sand built up at the mouth of the river, making it harder for big ships to pass.
People and Population
How Many People Live Here?
According to a study done in 2002 by the National Statistics Institute, Maullín covers an area of about 860.8 square kilometers. At that time, 15,580 people lived there.
Where Do People Live?
Out of the total population, 6,896 people (about 44.3%) lived in urban areas, which are towns and cities. The other 8,684 people (about 55.7%) lived in rural areas, which are countryside areas.
Population Changes Over Time
Between 1992 and 2002, the population of Maullín actually went down by 9%. This means about 1,535 fewer people lived there in 2002 compared to 1992.
Local Government
How Maullín is Run
Maullín is a commune, which is a type of local government area in Chile. It is managed by a municipal council. This council is led by an alcalde, who is like a mayor. The alcalde is chosen by the people in an election every four years.
The alcalde from 2008 to 2012 was Juan Cárcamo Cárcamo. He was a member of the PDC.
Fun Things to Do in Maullín
Retro Maullín Festival
During the summer, Maullín hosts a special event called the "Retro Maullín Festival." This festival brings in artists who perform classic, "retro" music. It's a unique festival in Chile!
Pangal Beach: A Peaceful Spot
About 4 kilometers from the city, you'll find "Pangal Beach." This beach is famous for its beautiful scenery and its calm, peaceful feeling. It's a wonderful place to relax during the summer.
Traditionalist Festival
In February, Pangal Beach also hosts the "Festival Traditionalist." People from all over southern Chile come to this festival. It's known for its delicious local food, old beliefs, traditional dances, and folk songs. It's a great way to experience the local culture!
Weather in Maullín
Maullín has a mild climate. Here's a quick look at the average temperatures and rainfall:
| Climate data for Maullín | |||||||||||||
|---|---|---|---|---|---|---|---|---|---|---|---|---|---|
| Month | Jan | Feb | Mar | Apr | May | Jun | Jul | Aug | Sep | Oct | Nov | Dec | Year |
| Mean daily maximum °C (°F) | 19.9 (67.8) |
19.8 (67.6) |
18.3 (64.9) |
15.6 (60.1) |
13.2 (55.8) |
11.3 (52.3) |
10.9 (51.6) |
11.4 (52.5) |
13.0 (55.4) |
14.8 (58.6) |
16.2 (61.2) |
17.9 (64.2) |
15.2 (59.3) |
| Daily mean °C (°F) | 13.6 (56.5) |
13.1 (55.6) |
11.5 (52.7) |
9.8 (49.6) |
8.1 (46.6) |
7.1 (44.8) |
6.6 (43.9) |
6.8 (44.2) |
7.6 (45.7) |
9.2 (48.6) |
10.8 (51.4) |
12.4 (54.3) |
9.7 (49.5) |
| Mean daily minimum °C (°F) | 9.3 (48.7) |
8.7 (47.7) |
7.2 (45.0) |
5.9 (42.6) |
4.8 (40.6) |
4.0 (39.2) |
3.4 (38.1) |
3.4 (38.1) |
4.1 (39.4) |
5.5 (41.9) |
6.9 (44.4) |
8.3 (46.9) |
6.0 (42.7) |
| Average precipitation mm (inches) | 81.6 (3.21) |
93.1 (3.67) |
129.0 (5.08) |
161.8 (6.37) |
239.4 (9.43) |
277.3 (10.92) |
237.6 (9.35) |
211.0 (8.31) |
162.6 (6.40) |
106.0 (4.17) |
103.3 (4.07) |
112.4 (4.43) |
1,915.1 (75.41) |
| Source: Bioclimatografia de Chile | |||||||||||||
See also
 In Spanish: Maullín para niños
 | Ernest Everett Just |
 | Mary Jackson |
 | Emmett Chappelle |
 | Marie Maynard Daly |


