Mayville, Michigan facts for kids
Quick facts for kids
Mayville, Michigan
|
|
|---|---|
|
Village
|
|

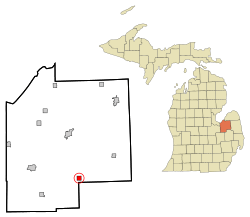
Location of Mayville, Michigan
|
|
| Country | United States |
| State | Michigan |
| County | Tuscola |
| Area | |
| • Total | 1.10 sq mi (2.84 km2) |
| • Land | 1.08 sq mi (2.79 km2) |
| • Water | 0.02 sq mi (0.05 km2) |
| Elevation | 912 ft (278 m) |
| Population
(2020)
|
|
| • Total | 922 |
| • Density | 856.08/sq mi (330.49/km2) |
| Time zone | UTC-5 (Eastern (EST)) |
| • Summer (DST) | UTC-4 (EDT) |
| ZIP code |
48744
|
| Area code(s) | 989 |
| FIPS code | 26-52540 |
| GNIS feature ID | 0631783 |
Mayville is a small village in Tuscola County, Michigan. In 2020, about 922 people lived there. The village is part of Fremont Township and borders Dayton Township.
Contents
Mayville's Location and History
Mayville covers about 1.15 square miles (2.98 square kilometers). Most of this area is land, with a small amount of water.
Mayville has one public school system for students from kindergarten through 12th grade. The school's sports teams are called the 'Mayville Wildcats'. Students from nearby towns like Silverwood and Fostoria also attend Mayville schools.
The village was started in 1865 by a person named Dexter Choat.
People Living in Mayville
| Historical population | |||
|---|---|---|---|
| Census | Pop. | %± | |
| 1880 | 248 | — | |
| 1890 | 728 | 193.5% | |
| 1900 | 825 | 13.3% | |
| 1910 | 687 | −16.7% | |
| 1920 | 652 | −5.1% | |
| 1930 | 654 | 0.3% | |
| 1940 | 736 | 12.5% | |
| 1950 | 888 | 20.7% | |
| 1960 | 896 | 0.9% | |
| 1970 | 872 | −2.7% | |
| 1980 | 958 | 9.9% | |
| 1990 | 1,010 | 5.4% | |
| 2000 | 1,055 | 4.5% | |
| 2010 | 950 | −10.0% | |
| 2020 | 922 | −2.9% | |
| U.S. Decennial Census | |||
In 2010, Mayville received a special grant from the U.S. Department of Energy. This grant helped the village make improvements to save energy. Mayville was one of 43 places to get this type of grant. These grants were given out to help improve the country's energy security.
Mayville's Population in 2010
According to the census from 2010, there were 950 people living in Mayville. These people lived in 369 households, and 235 of these were families.
Most of the people living in Mayville were White (96.1%). A small number were African American (0.5%), Native American (0.2%), or Asian (0.2%). About 2.4% of the people were from two or more racial backgrounds. About 2.5% of the population identified as Hispanic or Latino.
- About 33.6% of households had children under 18 living with them.
- 43.9% of households were married couples living together.
- 13.3% of households had a female head of the house with no husband present.
- 6.5% had a male head of the house with no wife present.
- 36.3% of households were not families.
About 32.0% of all households were made up of single individuals. Also, 12.7% of households had someone living alone who was 65 years old or older. On average, there were 2.43 people in each household and 3.05 people in each family.
The average age of people in Mayville was 41.1 years.
- 25.4% of residents were under 18 years old.
- 7.4% were between 18 and 24 years old.
- 21.9% were between 25 and 44 years old.
- 25% were between 45 and 64 years old.
- 20.1% were 65 years old or older.
The village had slightly more females (52.6%) than males (47.4%).
Mayville's Weather and Climate
Mayville has a type of weather where temperatures change a lot between seasons. Summers are warm to hot and often humid. Winters are cold, and sometimes very cold.
According to the Köppen Climate Classification system, Mayville has a humid continental climate. This means it has four distinct seasons with a good amount of rain or snow throughout the year.
| Climate data for Mayville, Michigan | |||||||||||||
|---|---|---|---|---|---|---|---|---|---|---|---|---|---|
| Month | Jan | Feb | Mar | Apr | May | Jun | Jul | Aug | Sep | Oct | Nov | Dec | Year |
| Mean daily maximum °C (°F) | −1 (30) |
0 (32) |
6 (43) |
14 (58) |
21 (70) |
27 (80) |
29 (84) |
27 (81) |
23 (74) |
17 (62) |
8 (47) |
1 (34) |
14 (58) |
| Mean daily minimum °C (°F) | −10 (14) |
−9 (16) |
−4 (24) |
1 (34) |
7 (44) |
12 (53) |
14 (58) |
13 (56) |
9 (49) |
4 (39) |
−2 (29) |
−7 (20) |
2 (36) |
| Average precipitation mm (inches) | 43 (1.7) |
33 (1.3) |
51 (2) |
71 (2.8) |
71 (2.8) |
84 (3.3) |
79 (3.1) |
76 (3) |
89 (3.5) |
66 (2.6) |
64 (2.5) |
48 (1.9) |
770 (30.5) |
| Source: Weatherbase | |||||||||||||
See also
 In Spanish: Mayville (Míchigan) para niños
 | James B. Knighten |
 | Azellia White |
 | Willa Brown |

