
Mundaun facts for kids
Quick facts for kids
Mundaun
|
||
|---|---|---|
 |
||
|
||

Mundaun
Location in Switzerland

Mundaun
Location in Canton of Graubünden
|
||
| Country | Switzerland | |
| Canton | Graubünden | |
| District | Surselva | |
| Area | ||
| • Total | 8.59 km2 (3.32 sq mi) | |
| Elevation | 1,346 m (4,416 ft) | |
| Population
(Dec 2014)
|
||
| • Total | 301 | |
| • Density | 35.04/km2 (90.76/sq mi) | |
| Postal code |
7137
|
|

Mundaun was once a small town, known as a municipality, located in the Surselva area of Graubünden, Switzerland. It was created on January 1, 2009, when two smaller towns, Flond and Surcuolm, joined together. Later, on January 1, 2016, Mundaun merged with Obersaxen to form a new, larger municipality called Obersaxen Mundaun.
Contents
Exploring Mundaun's Geography
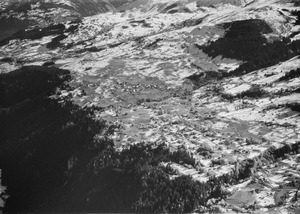
Mundaun covered an area of about 8.6 square kilometers (3.3 square miles) in 2006. A big part of this land, over 60%, was used for farming. Nearly 30% of the area was covered by forests.
The rest of the land included buildings and roads (about 4.7%). A small portion (5.7%) was made up of natural features like rivers, glaciers, or mountains. Mundaun was located on a high plateau called Obersaxen, which is south of the Vorderrhein river.
Who Lives in Mundaun?
In 2014, Mundaun had a population of 301 people. About 6.2% of these residents were from other countries.
Let's look at the age groups in Mundaun back in 2000:
- Children aged 0 to 9 years old made up 13.9% of the population (43 kids).
- Teenagers aged 10 to 19 years old were 14.2% of the population (44 teenagers).
For adults:
- Young adults aged 20 to 29 years old were 9.4% (29 people).
- People aged 30 to 39 years old were 15.9% (49 people).
- Those aged 40 to 49 years old were 14.6% (45 people).
- People aged 50 to 59 years old were 11.0% (34 people).
For seniors:
- People aged 60 to 69 years old were 7.8% (24 people).
- Those aged 70 to 79 years old were 9.1% (28 people).
- And 4.2% of the population, or 13 people, were between 80 and 89 years old.
Mundaun's Population Over Time
The table below shows how the number of people living in Mundaun changed over many years:
| year | population |
|---|---|
| 1850 | 363 |
| 1900 | 248 |
| 1940 | 291 |
| 1950 | 245 |
| 1990 | 237 |
| 2000 | 309 |
See also
 In Spanish: Mundaun para niños
