Neelyville, Missouri facts for kids
Quick facts for kids
Neelyville, Missouri
|
|
|---|---|

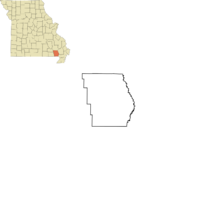
Location of Neelyville, Missouri
|
|
| Country | United States |
| State | Missouri |
| County | Butler |
| Area | |
| • Total | 1.15 sq mi (2.98 km2) |
| • Land | 1.15 sq mi (2.98 km2) |
| • Water | 0.00 sq mi (0.00 km2) |
| Elevation | 302 ft (92 m) |
| Population
(2020)
|
|
| • Total | 318 |
| • Density | 276.52/sq mi (106.80/km2) |
| Time zone | UTC-6 (Central (CST)) |
| • Summer (DST) | UTC-5 (CDT) |
| ZIP code |
63954
|
| Area code(s) | 573 |
| FIPS code | 29-51446 |
| GNIS feature ID | 2395164 |
Neelyville is a small city in Butler County, located in the southeastern part of Missouri, United States. In 2020, about 318 people lived there.
Neelyville is also part of the Poplar Bluff Micropolitan Statistical Area. This means it's connected to a larger nearby city for things like jobs and services.
Contents
History of Neelyville
Neelyville was first planned out in 1870. It was built along the St. Louis, Iron Mountain and Southern Railway, which was an important train line back then. The community got its name from Obadiah Neely, who was one of the first people to live there. A post office, where people could send and receive mail, has been open in Neelyville since 1873.
Geography of Neelyville
Neelyville is located along U.S. Route 67. This road is also part of the planned future I-57 corridor, which will be a major highway.
The United States Census Bureau says that the city covers a total area of about 1.15 square miles (2.98 square kilometers). All of this area is land, with no large bodies of water.
Population Changes Over Time
| Historical population | |||
|---|---|---|---|
| Census | Pop. | %± | |
| 1900 | 114 | — | |
| 1910 | 241 | 111.4% | |
| 1920 | 237 | −1.7% | |
| 1930 | 199 | −16.0% | |
| 1940 | 280 | 40.7% | |
| 1950 | 457 | 63.2% | |
| 1960 | 385 | −15.8% | |
| 1970 | 381 | −1.0% | |
| 1980 | 474 | 24.4% | |
| 1990 | 381 | −19.6% | |
| 2000 | 487 | 27.8% | |
| 2010 | 483 | −0.8% | |
| 2020 | 318 | −34.2% | |
| U.S. Decennial Census | |||
This table shows how Neelyville's population has changed over many years, from 1900 to 2020.
Neelyville in 2020
According to the 2020 United States census, there were 318 people living in Neelyville. There were 98 households, which means 98 different homes where people lived. The city had 155 housing units in total. About 26.1% of the people who could work had jobs. The average income for a household was $18,750, and the average age of people living there was 50 years old.
Neelyville in 2010
Back in 2010, there were 483 people living in Neelyville. They lived in 181 households, and 120 of these were families. The city had about 420 people per square mile. There were 213 housing units in total.
Most of the people in Neelyville were White (82.82%). About 12.42% were Black or African American, and a small number were Native American or Asian. About 3.52% of people were from two or more racial backgrounds. A very small number (0.41%) were Hispanic or Latino.
Out of the 181 households:
- 42.5% had children under 18 living with them.
- 40.3% were married couples.
- 17.7% had a female head of the household with no husband present.
- 8.3% had a male head of the household with no wife present.
- 33.7% were not families (like single people living alone).
The average household had 2.67 people, and the average family had 3.22 people.
The average age in the city was 33.9 years.
- 32.3% of residents were under 18 years old.
- 6.8% were between 18 and 24 years old.
- 26.2% were between 25 and 44 years old.
- 21.5% were between 45 and 64 years old.
- 13.3% were 65 years old or older.
The city had slightly more males (52.0%) than females (48.0%).
See also
 In Spanish: Neelyville (Misuri) para niños
 | John T. Biggers |
 | Thomas Blackshear |
 | Mark Bradford |
 | Beverly Buchanan |

