North Southwark and Bermondsey (UK Parliament constituency) facts for kids
Quick facts for kids {{{Name}}}[[{{{Type}}} constituency]] |
|
|---|---|
| [[Image:{{{Map1}}}Constituency.svg|120px|]] [[Image:England{{{Map2}}}.svg|120px|]] |
|
| {{{Name}}} shown within [[{{{Entity}}}]], and {{{Entity}}} shown within England | |
| Created: | {{{Year}}} |
| MP: | {{{MP}}} |
| Party: | {{{Party}}} |
| Type: | House of Commons |
| County: | [[{{{County}}}]] |
| EP constituency: | [[{{{EP}}} (European Parliament constituency)|{{{EP}}}]] |
North Southwark and Bermondsey was a special area in the United Kingdom that elected one person to be their voice in Parliament. This person is called a Member of Parliament (MP). MPs work in the House of Commons, which is part of the UK's government.
This area was created for the general election in 1997. Later, in 2010, its borders changed a little bit. Because of these small changes, the area was given a new name: Bermondsey and Old Southwark.
Contents
What are Parliamentary Boundaries?
Parliamentary boundaries are like invisible lines that divide a country into different areas. Each area, called a constituency, gets to choose one MP to represent the people living there. This makes sure everyone has a voice in Parliament.
Where was North Southwark and Bermondsey?
This area was located in the London Borough of Southwark. It included several local areas called wards, such as Abbey, Cathedral, and Rotherhithe. The name "North Southwark and Bermondsey" tells you it covered parts of the older areas known as Bermondsey and Southwark.
This constituency was first created in 1997. It mostly took over from an older area called Southwark & Bermondsey, which existed from 1983 to 1997. Before that, the main part of the area was known as the Bermondsey constituency.
A Look at the Constituency's History
For a more detailed history of this area before 1997, you can look up Southwark and Bermondsey.
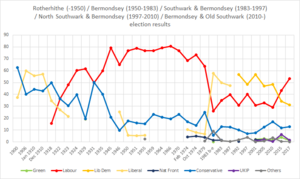
North Southwark and Bermondsey was quite special for a constituency in central London. For over 25 years, its MP was from the Liberal Democrat party. This was unusual because many areas in central London usually elected MPs from the Labour Party.
The 1983 Bermondsey By-election
Many people think the reason for this unusual situation goes back to a special election in 1983, called a by-election. Before this, the area had mostly elected Labour MPs for a long time.
During the 1983 by-election, the Liberal candidate, Simon Hughes, won the seat. He managed to keep winning elections in this area for many years. Sometimes, he was the only Liberal Democrat MP in all of London! Even when national election results suggested his party might lose, Simon Hughes often managed to hold onto his seat. For example, in the 1997 general election, he was told on TV that he had lost, but then the final results showed he had won with a good number of votes.
Changes in Local Politics
The London Borough of Southwark council was run by the Liberal Democrats until 2010. After some boundary changes, the constituency's name changed to Bermondsey and Old Southwark.
In the 2015 general election, the Labour Party finally won the seat. Neil Coyle became the new MP, ending Simon Hughes's 32-year career in Parliament.
Members of Parliament
The only MP for North Southwark and Bermondsey was Simon Hughes. He represented this area and its earlier versions from a by-election in 1983 until 2015. He was first a Liberal MP, and then a Liberal Democrat after 1988.
| Election | Member | Party | |
|---|---|---|---|
| 1997 | Simon Hughes | Liberal Democrats | |
| 2010 | Constituency abolished: see Bermondsey and Old Southwark | ||
Election Results
This section shows how people voted in the elections for this constituency.
Elections in the 1990s
| General election 1992: North Southwark and Bermondsey (Notional) | |||||
|---|---|---|---|---|---|
| Party | Candidate | Votes | % | ±% | |
| Liberal Democrats | 51.4 | ||||
| Labour | 34.5 | ||||
| Conservative | 12.0 | ||||
| Others | 2.1 | ||||
| Majority | 16.9 | ||||
| General election 1997: North Southwark and Bermondsey | |||||
|---|---|---|---|---|---|
| Party | Candidate | Votes | % | ±% | |
| Liberal Democrats | Simon Hughes | 19,831 | 48.6 | −2.8 | |
| Labour | Jeremy Fraser | 16,444 | 40.3 | +5.8 | |
| Conservative | Grant Shapps | 2,835 | 6.9 | −5.1 | |
| BNP | Michael Davidson | 713 | 1.7 | New | |
| Referendum | Bill Newton | 545 | 1.3 | New | |
| Communist League | Ian Grant | 175 | 0.4 | New | |
| Liberal | James Munday | 157 | 0.4 | New | |
| National Democrats | Ingga Yngvisson | 95 | 0.2 | New | |
| Majority | 3,387 | 8.3 | |||
| Turnout | 40,793 | 60.4 | |||
| Liberal Democrat win (new seat) | |||||
Elections in the 2000s
| General election 2001: North Southwark and Bermondsey | |||||
|---|---|---|---|---|---|
| Party | Candidate | Votes | % | ±% | |
| Liberal Democrats | Simon Hughes | 20,991 | 56.9 | +8.3 | |
| Labour | Kingsley Abrams | 11,359 | 30.8 | −9.5 | |
| Conservative | Ewan Wallace | 2,800 | 7.6 | +0.7 | |
| Green | Ruth Jenkins | 752 | 2.0 | New | |
| National Front | Lianne Shore | 612 | 1.7 | New | |
| UKIP | Robert McWhirter | 271 | 0.7 | New | |
| Communist League | John Davies | 77 | 0.2 | New | |
| Majority | 9,632 | 26.1 | +17.8 | ||
| Turnout | 35,150 | 50.1 | -10.3 | ||
| Liberal Democrat hold | Swing | ||||
| General election 2005: Southwark North & Bermondsey | |||||
|---|---|---|---|---|---|
| Party | Candidate | Votes | % | ±% | |
| Liberal Democrats | Simon Hughes | 17,874 | 47.1 | −9.8 | |
| Labour | Kirsty McNeill | 12,468 | 32.8 | +2.0 | |
| Conservative | David Branch | 4,752 | 12.5 | +4.9 | |
| Green | Storm Poorun | 1,137 | 3.0 | +1.0 | |
| UKIP | Linda Robson | 791 | 2.1 | +1.4 | |
| National Front | Paul Winnett | 704 | 1.9 | +0.2 | |
| CPA | Simisola Lawanson | 233 | 0.6 | New | |
| Majority | 5,406 | 14.3 | -11.8 | ||
| Turnout | 37,959 | 48.2 | −1.9 | ||
| Liberal Democrat hold | Swing | −5.9 | |||
See also
- Southwark local elections
 | Sharif Bey |
 | Hale Woodruff |
 | Richmond Barthé |
 | Purvis Young |


