
Northfleet Power Station facts for kids
Quick facts for kids Northfleet Power Station |
|
|---|---|

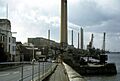
Northfleet Power Station from the south-west, 1973.
|
|
| Country | England |
| Location | Kent, South East England |
| Coordinates | 51°26′42″N 0°20′49″E / 51.445000°N 0.347000°E |
| Status | Decommissioned and demolished |
| Construction began | 1956 |
| Commission date | 1963 |
| Decommission date | 1991 |
| Owner(s) | Central Electricity Generating Board |
| Operator(s) | CEGB |
| grid reference TQ631744 | |
Northfleet Power Station was a large building that made electricity. It was located on the south bank of the River Thames in Northfleet, Kent, England. It first opened in 1963 and used coal to create power. Later, in 1972, it was changed to burn oil instead. The power station stopped working and closed down in 1991.
Contents
How Northfleet Power Station Worked
Northfleet Power Station was built on a large area of land. It had different sections for its main buildings, for storing coal, and for getting rid of waste materials. The main building was very long and contained the boiler house and the turbine hall.
The power station could produce a huge amount of electricity, up to 720 megawatts (MW). To give you an idea, 1 MW can power about 1,000 homes! It had six big machines, called generating units, and each one could make 120 MW of power.
Making Electricity
Each 120 MW unit worked like this:
- First, a large boiler would heat water using either coal or oil.
- This heating turned the water into very hot, high-pressure steam.
- The steam then rushed into a special machine called a steam turbine. The steam made the turbine spin very fast.
- The spinning turbine was connected to another machine called an alternator. The alternator's job was to turn the spinning motion into electricity.
Each unit had its own control room. Here, operators watched the machines to make sure everything was working correctly. Northfleet was one of the first power stations in the UK to use special computer systems to constantly check how the plant was running.
Fuel and Efficiency
When Northfleet Power Station burned coal, each boiler used about 50 tonnes of coal every hour! This coal arrived by ship and was stored before being ground into a fine powder. This powder was then blown into the boiler to burn.
The station was very efficient for its time. From 1963 to 1965, it was among the top 20 power stations in the UK for how well it turned fuel into electricity. About 33.67% of the energy from the fuel was turned into useful electricity.
Later Years and Closure
In 1972, Northfleet Power Station was changed from burning coal to burning oil. This was a big change in how it operated. The power station continued to produce electricity for many years until it finally closed in 1991. After it closed, the buildings were taken down.
In 2000, a new, smaller power station was built nearby. This new station uses natural gas to produce both heat and electricity for a paper mill in Northfleet.
Electricity Output Over Time
The graph below shows how much electricity Northfleet Power Station produced each year from 1961 to 1987. The numbers are in GWh, which stands for gigawatt-hours – a very large unit of electricity.
Northfleet annual electricity output GWh.<graph>{ "version": 2, "width": 800, "height": 300, "data": [ { "name": "table", "values": [ { "x": 1964, "y": 4185 }, { "x": 1965, "y": 3986 }, { "x": 1966, "y": 3531 }, { "x": 1967, "y": 3213 }, { "x": 1968, "y": 3685 }, { "x": 1969, "y": 4083 }, { "x": 1970, "y": 3015 }, { "x": 1971, "y": 2965 }, { "x": 1972, "y": 1399 }, { "x": 1973, "y": 3171 }, { "x": 1974, "y": 3085 }, { "x": 1975, "y": 3038 }, { "x": 1976, "y": 2201 }, { "x": 1977, "y": 1155 }, { "x": 1978, "y": 1676 }, { "x": 1979, "y": 1661 }, { "x": 1980, "y": 665 }, { "x": 1981, "y": 169 }, { "x": 1982, "y": 284 }, { "x": 1983, "y": 30 }, { "x": 1984, "y": 26 }, { "x": 1985, "y": 2100 }, { "x": 1986, "y": 137 }, { "x": 1987, "y": 111 }, { "x": 1961, "y": 734 }, { "x": 1962, "y": 2467 }, { "x": 1963, "y": 3894 } ] } ], "scales": [ { "name": "x", "type": "ordinal", "range": "width", "zero": false, "domain": { "data": "table", "field": "x" } }, { "name": "y", "type": "linear", "range": "height", "nice": true, "domain": { "data": "table", "field": "y" } } ], "axes": [ { "type": "x", "scale": "x" }, { "type": "y", "scale": "y" } ], "marks": [ { "type": "rect", "from": { "data": "table" }, "properties": { "enter": { "x": { "scale": "x", "field": "x" }, "y": { "scale": "y", "field": "y" }, "y2": { "scale": "y", "value": 0 }, "fill": { "value": "steelblue" }, "width": { "scale": "x", "band": "true", "offset": -1 } } } } ] }</graph>
Images for kids
-
Northfleet Power Station seen from the east, 1973.

