Osgood, Ohio facts for kids
Quick facts for kids
Osgood, Ohio
|
|
|---|---|
|
Village
|
|
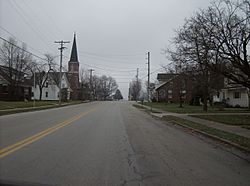
Main Street in Osgood
|
|
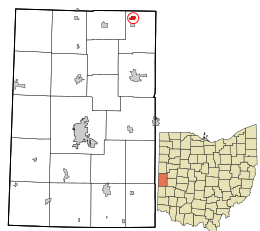
Location in Darke County and the state of Ohio
|
|
| Country | United States |
| State | Ohio |
| County | Darke |
| Township | Patterson |
| Area | |
| • Total | 0.35 sq mi (0.91 km2) |
| • Land | 0.35 sq mi (0.91 km2) |
| • Water | 0.00 sq mi (0.00 km2) |
| Elevation | 961 ft (293 m) |
| Population
(2020)
|
|
| • Total | 306 |
| • Density | 869.32/sq mi (335.64/km2) |
| Time zone | UTC-5 (Eastern (EST)) |
| • Summer (DST) | UTC-4 (EDT) |
| ZIP code |
45351
|
| Area code(s) | 419 |
| FIPS code | 39-58912 |
| GNIS feature ID | 2399590 |
Osgood is a small village located in Darke County, Ohio, in the United States. In 2020, about 306 people lived there. It's a quiet community with a rich history.
Contents
A Look Back: Osgood's History
Osgood started as a village in the 1880s. When it was first settled, most people followed the Protestant faith. Later, in 1906, a Roman Catholic church was built in the village. This church, called St. Nicholas' Catholic Church, is now known as a historic site. This means it's an important place from the past.
Where is Osgood?
Osgood is located in the state of Ohio. The United States Census Bureau says that the village covers an area of about 0.34 square miles (0.91 square kilometers). All of this area is land, meaning there are no large lakes or rivers within the village limits.
Who Lives in Osgood?
This section tells us about the people who live in Osgood, like how many there are and what groups they belong to.
Population Changes Over Time
The number of people living in Osgood has changed over many years, as shown by the U.S. Decennial Census.
| Historical population | |||
|---|---|---|---|
| Census | Pop. | %± | |
| 1890 | 242 | — | |
| 1900 | 224 | −7.4% | |
| 1910 | 214 | −4.5% | |
| 1920 | 175 | −18.2% | |
| 1930 | 152 | −13.1% | |
| 1940 | 179 | 17.8% | |
| 1950 | 194 | 8.4% | |
| 1960 | 241 | 24.2% | |
| 1970 | 289 | 19.9% | |
| 1980 | 306 | 5.9% | |
| 1990 | 255 | −16.7% | |
| 2000 | 255 | 0.0% | |
| 2010 | 302 | 18.4% | |
| 2020 | 306 | 1.3% | |
| U.S. Decennial Census | |||
Osgood in 2010
In 2010, the census counted 302 people living in Osgood. These people lived in 120 different homes, and 82 of these were families.
Most of the people in Osg0od were White, making up about 98.3% of the population. A small number, 1.7%, were Native American. About 1.3% of the population identified as Hispanic or Latino.
In terms of homes, 30% of them had children under 18 living there. Most homes (60.8%) were married couples living together. About 29.2% of all homes had just one person living in them. Also, 20% of homes had someone living alone who was 65 years old or older.
The average age of people in the village was 38.4 years. About 28.5% of residents were under 18. About 22.2% were 65 years old or older. The village had slightly more males (52.6%) than females (47.4%).
See also
 In Spanish: Osgood (Ohio) para niños
 | Toni Morrison |
 | Barack Obama |
 | Martin Luther King Jr. |
 | Ralph Bunche |

