Otisville, Michigan facts for kids
Quick facts for kids
Otisville, Michigan
|
|
|---|---|
|
Village
|
|

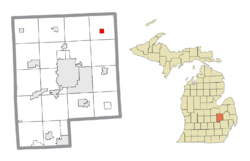
Location within Genesee County
|
|
| Country | United States |
| State | Michigan |
| County | Genesee |
| Township | Forest |
| Settled | 1836 |
| Platted | 1863 |
| Incorporated | 1877 |
| Government | |
| • Type | Village council |
| Area | |
| • Total | 0.97 sq mi (2.52 km2) |
| • Land | 0.88 sq mi (2.28 km2) |
| • Water | 0.09 sq mi (0.24 km2) 9.28% |
| Elevation | 814 ft (248 m) |
| Population
(2020)
|
|
| • Total | 819 |
| • Density | 929.63/sq mi (358.97/km2) |
| Time zone | UTC-5 (EST) |
| • Summer (DST) | UTC-4 (EDT) |
| ZIP code(s) |
48463
|
| Area code(s) | 810 |
| FIPS code | 26-61600 |
| GNIS feature ID | 0634154 |
Otisville is a small village located in Forest Township, Genesee County in the U.S. state of Michigan. In 2020, about 819 people lived there. You can find Otisville along M-15, just south of M-57. It's also considered part of the larger Flint metropolitan area.
Contents
History of Otisville: How it Began
The first person to claim land in the area, then known as Forest, was James Seymour in March 1836. The very first settlers, Henry Heister and his family, arrived in 1837. The local government, called a township, was set up in 1837. Nathaniel Smith, another early settler, was chosen as the supervisor.
In 1851, John Hayes built a sawmill, which is a factory for cutting wood. He sold it to Francis Otis the next year. The village's post office opened on February 14, 1855, with John Crawford as the first postmaster. On April 5, 1861, the post office was officially renamed Otisville. The village was mapped out and planned by William F. Otis and T.D. Crocker in 1863. A train station for the Pere Marquette Railway opened in the village in 1874.
The Village of Otisville officially became an incorporated village in 1877. This means it got its own local government.
Geography: Where Otisville is Located
Otisville is located in Michigan. According to the United States Census Bureau, the village covers a total area of 0.97 square miles (2.51 km2). Most of this area, about 0.88 square miles (2.28 km2), is land. The rest, about 0.09 square miles (0.23 km2), is water.
Population and People in Otisville
A census is a count of all the people living in a place. It happens every ten years in the United States. Here's how Otisville's population has changed over time:
| Historical population | |||
|---|---|---|---|
| Census | Pop. | %± | |
| 1880 | 349 | — | |
| 1890 | 277 | −20.6% | |
| 1900 | 291 | 5.1% | |
| 1910 | 312 | 7.2% | |
| 1920 | 364 | 16.7% | |
| 1930 | 450 | 23.6% | |
| 1940 | 534 | 18.7% | |
| 1950 | 592 | 10.9% | |
| 1960 | 701 | 18.4% | |
| 1970 | 724 | 3.3% | |
| 1980 | 682 | −5.8% | |
| 1990 | 724 | 6.2% | |
| 2000 | 882 | 21.8% | |
| 2010 | 864 | −2.0% | |
| 2020 | 819 | −5.2% | |
| U.S. Decennial Census | |||
What the 2010 Census Shows
In 2010, the census counted 864 people living in Otisville. There were 342 households, which are groups of people living together in one home. Out of these, 225 were families. The village had about 981.8 people per square mile.
Most of the people living in Otisville in 2010 were White (97.8%). A small number were African American (0.5%), Native American (0.5%), or Asian (0.1%). About 1.0% of the population identified with two or more races. People of Hispanic or Latino background made up 1.2% of the population.
About 36.3% of households had children under 18 living with them. Nearly half (46.2%) were married couples living together. Some households had a female head without a husband (13.5%), or a male head without a wife (6.1%). About 30.4% of all households were made up of just one person.
The average age of people in the village was 36.9 years old. About 27.3% of residents were under 18. People aged 65 or older made up 13.2% of the population. The village had a nearly equal number of males (49.7%) and females (50.3%).
See also
 In Spanish: Otisville (Míchigan) para niños
 | Jackie Robinson |
 | Jack Johnson |
 | Althea Gibson |
 | Arthur Ashe |
 | Muhammad Ali |


