Point Comfort, Texas facts for kids
Quick facts for kids
Point Comfort, Texas
|
|
|---|---|

Location of Point Comfort, Texas
|
|
 |
|
| Country | United States |
| State | Texas |
| County | Calhoun |
| Area | |
| • Total | 1.32 sq mi (3.41 km2) |
| • Land | 1.31 sq mi (3.41 km2) |
| • Water | 0.00 sq mi (0.00 km2) |
| Elevation | 20 ft (6 m) |
| Population
(2020)
|
|
| • Total | 603 |
| • Density | 456.8/sq mi (176.8/km2) |
| Time zone | UTC-6 (Central (CST)) |
| • Summer (DST) | UTC-5 (CDT) |
| ZIP code |
77978
|
| Area code(s) | 361 |
| FIPS code | 48-58568 |
| GNIS feature ID | 2411451 |
Point Comfort is a small city located in Calhoun County, Texas, in the United States. It is part of the larger Victoria, Texas Metropolitan Statistical Area. In 2020, the city had a population of 603 people.
Contents
Where is Point Comfort?
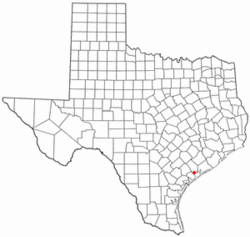
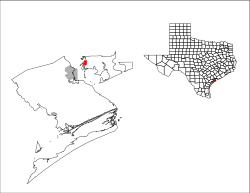
Point Comfort is found in the northeastern part of Calhoun County. It sits on the eastern side of Lavaca Bay. Texas State Highway 35 runs through the city. This highway connects Point Comfort to Port Lavaca, which is about 7 miles (11 km) to the southwest. Port Lavaca is also the main city of Calhoun County. The highway also goes east for about 23 miles (37 km) to Palacios.
The city covers a total area of about 1.32 square miles (3.4 square kilometers). All of this area is land.
What is the Climate Like?
Point Comfort has a climate known as a humid subtropical climate. This means the summers are hot and humid. The winters are generally mild to cool. You might see this climate type called "Cfa" on climate maps.
| Climate data for Point Comfort, Texas, 1991–2020 normals, extremes 1957–present | |||||||||||||
|---|---|---|---|---|---|---|---|---|---|---|---|---|---|
| Month | Jan | Feb | Mar | Apr | May | Jun | Jul | Aug | Sep | Oct | Nov | Dec | Year |
| Record high °F (°C) | 84 (29) |
91 (33) |
95 (35) |
98 (37) |
99 (37) |
106 (41) |
103 (39) |
106 (41) |
107 (42) |
96 (36) |
95 (35) |
86 (30) |
107 (42) |
| Mean maximum °F (°C) | 76.5 (24.7) |
79.5 (26.4) |
81.9 (27.7) |
86.7 (30.4) |
90.0 (32.2) |
94.1 (34.5) |
95.0 (35.0) |
97.2 (36.2) |
94.5 (34.7) |
90.5 (32.5) |
83.5 (28.6) |
79.3 (26.3) |
98.1 (36.7) |
| Mean daily maximum °F (°C) | 64.0 (17.8) |
67.7 (19.8) |
72.6 (22.6) |
78.3 (25.7) |
84.0 (28.9) |
89.4 (31.9) |
91.2 (32.9) |
92.4 (33.6) |
88.7 (31.5) |
82.7 (28.2) |
73.7 (23.2) |
66.7 (19.3) |
79.3 (26.3) |
| Daily mean °F (°C) | 54.8 (12.7) |
58.6 (14.8) |
64.6 (18.1) |
70.6 (21.4) |
77.4 (25.2) |
82.9 (28.3) |
84.8 (29.3) |
85.3 (29.6) |
80.9 (27.2) |
73.6 (23.1) |
64.4 (18.0) |
57.3 (14.1) |
71.3 (21.8) |
| Mean daily minimum °F (°C) | 45.7 (7.6) |
49.4 (9.7) |
56.5 (13.6) |
62.9 (17.2) |
70.7 (21.5) |
76.4 (24.7) |
78.4 (25.8) |
78.2 (25.7) |
73.2 (22.9) |
64.5 (18.1) |
55.0 (12.8) |
48.0 (8.9) |
63.2 (17.4) |
| Mean minimum °F (°C) | 31.4 (−0.3) |
34.6 (1.4) |
38.9 (3.8) |
45.7 (7.6) |
56.4 (13.6) |
66.8 (19.3) |
71.7 (22.1) |
71.3 (21.8) |
60.6 (15.9) |
46.6 (8.1) |
38.0 (3.3) |
32.0 (0.0) |
28.3 (−2.1) |
| Record low °F (°C) | 14 (−10) |
18 (−8) |
23 (−5) |
33 (1) |
44 (7) |
56 (13) |
59 (15) |
60 (16) |
40 (4) |
35 (2) |
26 (−3) |
9 (−13) |
9 (−13) |
| Average precipitation inches (mm) | 3.11 (79) |
1.84 (47) |
3.20 (81) |
2.61 (66) |
4.25 (108) |
4.85 (123) |
3.15 (80) |
3.42 (87) |
4.82 (122) |
3.65 (93) |
3.57 (91) |
2.92 (74) |
41.39 (1,051) |
| Average precipitation days (≥ 0.01 in) | 8.7 | 7.4 | 6.6 | 5.4 | 6.3 | 8.1 | 5.9 | 6.7 | 8.9 | 7.1 | 7.2 | 8.7 | 87.0 |
| Source 1: NOAA | |||||||||||||
| Source 2: National Weather Service | |||||||||||||
Who Lives in Point Comfort?
The number of people living in Point Comfort has changed over the years.
| Historical population | |||
|---|---|---|---|
| Census | Pop. | %± | |
| 1970 | 1,446 | — | |
| 1980 | 1,125 | −22.2% | |
| 1990 | 956 | −15.0% | |
| 2000 | 781 | −18.3% | |
| 2010 | 737 | −5.6% | |
| 2020 | 603 | −18.2% | |
| U.S. Decennial Census | |||
2020 Population Details
In 2020, the city had 603 residents. These people lived in 221 households, with 140 of those being families. The population is made up of different groups, as shown in the table below:
| Race | Number | Percentage |
|---|---|---|
| White (NH) | 301 | 49.92% |
| Black or African American (NH) | 11 | 1.82% |
| Native American or Alaska Native (NH) | 2 | 0.33% |
| Asian (NH) | 15 | 2.49% |
| Some Other Race (NH) | 4 | 0.66% |
| Mixed/Multi-Racial (NH) | 25 | 4.15% |
| Hispanic or Latino | 245 | 40.63% |
| Total | 603 |
Education in Point Comfort
Students in Point Comfort attend schools within the Calhoun County Independent School District. While Point Comfort Elementary School is now closed, students go to Travis Middle School and Calhoun High School. Both of these schools are located in Port Lavaca.
What is the Economy Like?
Point Comfort is home to a large industrial plant. This plant is owned by a company called Formosa. The plant has been involved in some environmental discussions. For example, there were concerns about waste and its impact on the local environment. These issues were even featured in an episode of a Netflix show called Dirty Money in 2020.
See also
 In Spanish: Point Comfort (Texas) para niños
 | Georgia Louise Harris Brown |
 | Julian Abele |
 | Norma Merrick Sklarek |
 | William Sidney Pittman |

