
R (programming language) facts for kids

Terminal window for R
|
|
| Paradigms | Multi-paradigm: procedural, object-oriented, functional, reflective, imperative, array |
|---|---|
| Designed by | Ross Ihaka and Robert Gentleman |
| Developer | R Core Team |
| First appeared | August 1993 |
| Stable release |
4.5.1
|
| Typing discipline | Dynamic |
| Platform | arm64 and x86-64 |
| License | GPL-2.0-or-later |
| Filename extensions |
|
| Influenced by | |
| Influenced | |
| Julia pandas | |
|
|
|
R is a special programming language used for working with numbers and making cool charts. It's super popular in areas like data analysis, where people look for patterns in information, and data science, which is all about understanding and using data.
The main R language can do a lot, but it gets even better with "packages." These are like add-ons that give R new powers. They contain ready-to-use code, helpful instructions, and sample data. One famous set of packages is called tidyverse. It makes it easier to show data visually, change it, and build models.
R is also free and open-source software. This means anyone can use it, share it, and even change it. It works on many different computer systems, including Linux, MacOS, and Microsoft Windows.
You can use R by typing commands into a special window. But there are also other programs that make R easier to use, like RStudio. RStudio is an integrated development environment (IDE), which is like a super-powered text editor for writing code. Another popular tool is Jupyter, which lets you create "notebooks" that mix code, text, and results.
Contents
How R Started
- Co-originators of the R language
-

Ross Ihaka
-

Robert Gentleman
.jpg)

R was created by two professors, Ross Ihaka and Robert Gentleman. They started it to teach basic statistics at the University of Auckland in New Zealand.
The language was inspired by another programming language called S. Most programs written in S could even run in R without changes! R also got ideas from Scheme, which helped it handle "local variables" (information that only exists inside a specific part of the code).
The name "R" comes from two things: it's a follow-up to the S language, and it's the first letter of both creators' names: Ross and Robert. In August 1993, Ihaka and Gentleman shared an early version of R online. Then, in December 1997, R became part of the GNU project, which supports free software. Version 1.0 of R was released on February 29, 2000.
R Packages: Adding New Powers

R packages are like special toolkits for R. They contain groups of functions (commands), instructions, and data that make R even more powerful. For example, packages can help you create reports or perform different types of statistical tests. It's easy to install and use these packages, which is why R is so popular in data science.
When you first install R, it comes with "base packages." These are the essential tools you need for basic programming, calculations, making graphics, and doing simple statistics.
The tidyverse is a great example of a package collection. It brings together several smaller packages that work well together. Tidyverse is especially good for working with "tidy data." This is data organized neatly in a table, with each row being one observation and each column being one type of information.
Installing a package is simple and only needs to be done once. For example, to get the tidyverse collection, you would type:
> install.packages("tidyverse")After installing, you "load" a package to use its tools. You do this with the library() command. To load tidyverse, you could type:
> # The package name can be enclosed in quotes
> library("tidyverse")

> # But the package name can also be used without quotes
> library(tidyverse)
The Comprehensive R Archive Network (CRAN) was started in 1997. It's a huge online library where you can find R's main code, ready-to-use programs, instructions, and thousands of packages made by users. As of June 30, 2025, CRAN has over 22,000 packages!
CRAN also has "Task Views" that help you find packages for specific topics. These topics include things like finance, genetics, machine learning, and social sciences.
The R Community
Many groups help support R and its development:
- The R Core Team started in 1997 to keep the main R code running smoothly.
- The R Foundation for Statistical Computing began in 2003 to provide money to support R.
- The R Consortium is a project that helps build the tools and systems R needs.
The R Journal is an online magazine where people write articles about how to use and improve R. It shares tips, news about packages, and updates from the R Foundation.
The R community also holds many conferences and meetings. Some of these include:
- UseR!: A big international conference for R users.
- R-Ladies: An organization that encourages more girls and women to join the R community.
- SatRdays: R-focused conferences held on Saturdays.
- posit::conf (formerly rstudio::conf): Another major conference for R users.
On social media, you can often find news and discussions about R by looking for the hashtag #rstats.
Simple R Examples
Let's look at some basic examples of how R code works.
Hello, World!
This is a classic first program in any language. It just makes the computer say "Hello, World!"
> print("Hello, World!")
[1] "Hello, World!"
You can also use the cat() function to do the same thing:
> cat("Hello, World!")
Hello, World!
Basic Commands
In R, you often use an arrow <- to give a name to something, like a number or a list of numbers. This is called an "assignment operator."
> x <- 1:6 # This creates a list of numbers from 1 to 6 and calls it 'x'.
> y <- x^2 # This creates a new list 'y' where each number is 'x' squared.
> print(y) # This shows you what's inside 'y'.
[1]  1  4  9 16 25 36

> z <- x + y # This creates 'z' by adding the numbers in 'x' and 'y' together.
> z # This shows you the contents of 'z'.
[1]  2  6 12 20 30 42

> z_matrix <- matrix(z, nrow = 3) # This turns the list 'z' into a grid (matrix) with 3 rows.
> z_matrix
     [,1] [,2]
[1,]    2   20
[2,]    6   30
[3,]   12   42

> new_df <- data.frame(t(z_matrix), row.names = c("A", "B")) # This creates a "data frame," which is like a spreadsheet.
> names(new_df) <- c("X", "Y", "Z") # This gives names to the columns: X, Y, Z.
> print(new_df)  # This shows you the data frame.
   X  Y  Z
A  2  6 12
B 20 30 42

> new_df$Z # This shows you only the numbers in the 'Z' column.
[1] 12 42
How to Create Your Own Functions
R lets you create your own special commands, called "functions." These are useful for doing the same task many times. Anything you create inside a function stays private to that function.
Here's an example of a function that does a math calculation:
# This function is named 'f'. It takes two inputs, 'x' and 'y'.
# It calculates '3 times x plus 4 times y'.
f <- function(x, y) {
  z <- 3 * x + 4 * y

  # The 'return(z)' line tells the function to give back the value of 'z'.
  return(z)
}

# You can also write shorter functions like this:
f <- function(x, y) 3 * x + 4 * y
Here's what happens when you use this function:
> f(1, 2) # This means x=1, y=2. So, 3*1 + 4*2 = 3 + 8 = 11.
[1] 11

> f(c(1, 2, 3), c(5, 3, 4)) # This does the calculation for each pair of numbers.
[1] 23 18 25
The Pipe Operator
In R version 4.1.0 (released in 2021), a new tool called the "pipe operator" |> was added. It helps you chain commands together, making your code easier to read. Instead of putting one command inside another, you can send the result of one command directly to the next.
> nrow(subset(mtcars, cyl == 4)) # This is how you might do it without the pipe.
[1] 11

> mtcars |> subset(cyl == 4) |> nrow() # This uses the pipe. It's like saying: "Take 'mtcars', THEN 'subset' it, THEN count the 'nrow'."
[1] 11
Using the pipe can make your code flow better, like a story.
Modeling and Plotting Data

R is great for building mathematical models and creating graphs. This example shows how R can make a "linear model" (a straight line that best fits some data) and then draw pictures to check the model.
# Create x and y values
x <- 1:6
y <- x^2

# Build a linear model: trying to explain 'y' using 'x'
model <- lm(y ~ x)

# Show a detailed summary of the model
summary(model)

# Arrange the plots in a 2-by-2 grid
par(mfrow = c(2, 2))

# Show diagnostic plots of the model
plot(model)
The summary() command gives you a lot of information about the model, like how well the line fits the data.
R Version Names

Since version 2.14.0, all R releases have fun "codenames." These names are inspired by the Peanuts comics and movies.
Some important early versions before the codenames include:
- Version 1.0.0, released on February 29, 2000 (a leap day).
- Version 2.0.0, released on October 4, 2004, which had a "nice ring to it."
The idea for these names came from other software projects like Debian and Ubuntu. One of the R developers, Peter Dalgaard, also joked that "everyone in statistics is a P-nut!"
| Version | Release date | Name | Peanuts reference | Reference |
|---|---|---|---|---|
| 4.5.1 | 2025-06-13 | Great Square Root | ||
| 4.5.0 | 2025-04-11 | How About a Twenty-Six | ||
| 4.4.3 | 2025-02-28 | Trophy Case | ||
| 4.4.2 | 2024-10-31 | Pile of Leaves | ||
| 4.4.1 | 2024-06-14 | Race for Your Life | ||
| 4.4.0 | 2024-04-24 | Puppy Cup | ||
| 4.3.3 | 2024-02-29 | Angel Food Cake | ||
| 4.3.2 | 2023-10-31 | Eye Holes | ||
| 4.3.1 | 2023-06-16 | Beagle Scouts | ||
| 4.3.0 | 2023-04-21 | Already Tomorrow | ||
| 4.2.3 | 2023-03-15 | Shortstop Beagle | ||
| 4.2.2 | 2022-10-31 | Innocent and Trusting | ||
| 4.2.1 | 2022-06-23 | Funny-Looking Kid | ||
| 4.2.0 | 2022-04-22 | Vigorous Calisthenics | ||
| 4.1.3 | 2022-03-10 | One Push-Up | ||
| 4.1.2 | 2021-11-01 | Bird Hippie | ||
| 4.1.1 | 2021-08-10 | Kick Things | ||
| 4.1.0 | 2021-05-18 | Camp Pontanezen | ||
| 4.0.5 | 2021-03-31 | Shake and Throw | ||
| 4.0.4 | 2021-02-15 | Lost Library Book | ||
| 4.0.3 | 2020-10-10 | Bunny-Wunnies Freak Out | ||
| 4.0.2 | 2020-06-22 | Taking Off Again | ||
| 4.0.1 | 2020-06-06 | See Things Now | ||
| 4.0.0 | 2020-04-24 | Arbor Day | ||
| 3.6.3 | 2020-02-29 | Holding the Windsock | ||
| 3.6.2 | 2019-12-12 | Dark and Stormy Night | See It was a dark and stormy night#Literature | |
| 3.6.1 | 2019-07-05 | Action of the Toes | ||
| 3.6.0 | 2019-04-26 | Planting of a Tree | ||
| 3.5.3 | 2019-03-11 | Great Truth | ||
| 3.5.2 | 2018-12-20 | Eggshell Igloos | ||
| 3.5.1 | 2018-07-02 | Feather Spray | ||
| 3.5.0 | 2018-04-23 | Joy in Playing | ||
| 3.4.4 | 2018-03-15 | Someone to Lean On | ||
| 3.4.3 | 2017-11-30 | Kite-Eating Tree | See Kite-Eating Tree | |
| 3.4.2 | 2017-09-28 | Short Summer | See It Was a Short Summer, Charlie Brown | |
| 3.4.1 | 2017-06-30 | Single Candle | ||
| 3.4.0 | 2017-04-21 | You Stupid Darkness | ||
| 3.3.3 | 2017-03-06 | Another Canoe | ||
| 3.3.2 | 2016-10-31 | Sincere Pumpkin Patch | ||
| 3.3.1 | 2016-06-21 | Bug in Your Hair | ||
| 3.3.0 | 2016-05-03 | Supposedly Educational | ||
| 3.2.5 | 2016-04-11 | Very, Very Secure Dishes | ||
| 3.2.4 | 2016-03-11 | Very Secure Dishes | ||
| 3.2.3 | 2015-12-10 | Wooden Christmas-Tree | See A Charlie Brown Christmas | |
| 3.2.2 | 2015-08-14 | Fire Safety | ||
| 3.2.1 | 2015-06-18 | World-Famous Astronaut | ||
| 3.2.0 | 2015-04-16 | Full of Ingredients | ||
| 3.1.3 | 2015-03-09 | Smooth Sidewalk | ||
| 3.1.2 | 2014-10-31 | Pumpkin Helmet | See You're a Good Sport, Charlie Brown | |
| 3.1.1 | 2014-07-10 | Sock it to Me | ||
| 3.1.0 | 2014-04-10 | Spring Dance | ||
| 3.0.3 | 2014-03-06 | Warm Puppy | ||
| 3.0.2 | 2013-09-25 | Frisbee Sailing | ||
| 3.0.1 | 2013-05-16 | Good Sport | ||
| 3.0.0 | 2013-04-03 | Masked Marvel | ||
| 2.15.3 | 2013-03-01 | Security Blanket | ||
| 2.15.2 | 2012-10-26 | Trick or Treat | ||
| 2.15.1 | 2012-06-22 | Roasted Marshmallows | ||
| 2.15.0 | 2012-03-30 | Easter Beagle | ||
| 2.14.2 | 2012-02-29 | Gift-Getting Season | See It's the Easter Beagle, Charlie Brown | |
| 2.14.1 | 2011-12-22 | December Snowflakes | ||
| 2.14.0 | 2011-10-31 | Great Pumpkin | See It's the Great Pumpkin, Charlie Brown | |
| r-devel | N/A | Unsuffered Consequences |
Ways to Use R
- Examples of user interfaces for R
-
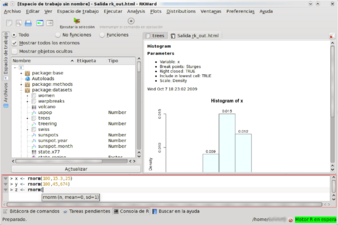
Screenshot of the RKWard front-end running on the KDE 4 environment
-
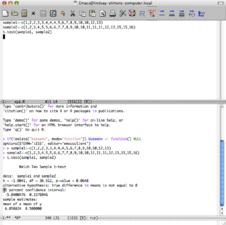
R running in the emacs editor with the ESS package
-
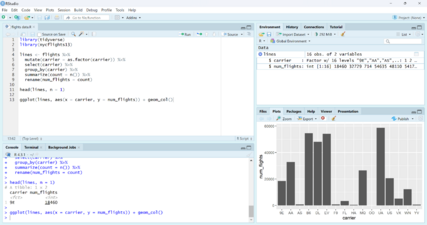
RStudio integrated development environment (IDE)


.png)
R comes with a basic window where you type commands. But there are many other ways to work with R:
- Integrated Development Environments (IDEs): These are special programs that make writing and running R code much easier. Examples include RStudio, R.app (for Mac), and RKWard.
- Other Programming Languages: You can even use R together with other popular programming languages like Python, Perl, and Julia.
Who Supports R?
Even though R is free and open-source, some companies offer special help and support for it. For example, Oracle and IBM provide commercial support for using R with their other big data products.
See also
 In Spanish: R (lenguaje de programación) para niños
- Comparison of statistical packages
- List of statistical software
