Romoland, California facts for kids
Quick facts for kids
Romoland
|
|
|---|---|

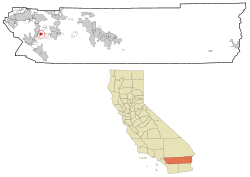
Location in Riverside County and the state of California
|
|
| Country | United States |
| State | California |
| County | Riverside |
| Area | |
| • Total | 2.644 sq mi (6.849 km2) |
| • Land | 2.644 sq mi (6.849 km2) |
| • Water | 0 sq mi (0 km2) 0% |
| Elevation | 1,444 ft (440 m) |
| Population
(2020)
|
|
| • Total | 2,005 |
| • Density | 758.3/sq mi (292.74/km2) |
| Time zone | UTC-8 (PST) |
| • Summer (DST) | UTC-7 (PDT) |
| ZIP code |
92585
|
| Area code(s) | 951 |
| FIPS code | 06-62756 |
| GNIS feature ID | 1661327 |
Romoland is a small community in Riverside County, California. It is called a census-designated place (CDP). This means it's an area that the U.S. Census Bureau defines for gathering population data. In 2020, about 2,005 people lived there. This was more than the 1,684 people counted in 2010.
History of Romoland
Early Beginnings: Ethanac Post Office
The story of Romoland began on June 25, 1900. The first post office in the area was set up across Highway 74. It was named Ethanac, after an early settler named Ethan Allen Chase. John Gaston was the first postmaster, which is the person in charge of a post office.
Changing Names: From Romola Farms to Romoland
In 1925, the town of Ethanac got a new name: "Romola Farms." This change happened because the Pacific Mutual Life Insurance Company started developing the area. They sold small farms, about four to five acres each. People bought these farms to grow fig trees and grapes.
The project became very popular. Because of this, the Ethanac post office also changed its name to Romola Farms. However, the Post Office Department asked for another name change. They wanted to avoid confusion with the Ramona post office in San Diego County. So, the name was changed one last time to Romoland. No one has ever fully explained how the name "Romoland" was chosen.
Motte's Romola Farms Barn and Museum
In 1985, Leon E. Motte built the "Motte's Romola Farms" Barn. It was located off Highway 74 and designed by architect Robert Morris. The barn was special because it was built using only salvaged materials.
For 10 years, the Motte family sold fresh produce from the barn. Later, they rented it out to other food sellers like Tom's Farms. In 2011, the barn reopened as the Motte Historical Museum. Today, it is a classic car museum. It also shows the history of the valley and its farming past. The "Motte's Romola Farms" Barn has always been a well-known landmark on Highway 74.
Becoming Part of Menifee
On October 1, 2008, a large part of Romoland joined a new city. This new city was Menifee.
Geography of Romoland
Romoland is located at specific coordinates: 33 degrees, 44 minutes, 45 seconds North and 117 degrees, 10 minutes, 27 seconds West.
Area and Land Use
The United States Census Bureau says that Romoland covers about 2.6 square miles (6.8 square kilometers). All of this area is land, meaning there are no lakes or large bodies of water within its borders.
Historical Romoland Region
Before Menifee became a city in 2008, the Romoland area was much larger. It included all the undeveloped land between Perris, Homeland, Nuevo, and Menifee. At that time, the total population of this larger area might have been over 100,000 people. This wider region covered about 30 square miles (78 square kilometers).
The school district for Romoland used to reach as far east as Green Acres, which is east of Homeland. Menifee and Nuevo have their own separate school districts. When the community of Sun City was built, Menifee then included that area too.
Past Names for the Area
According to the Geographic Names Information System, Romoland was also known by other names in the past. These names included Ethanac and Ethanac Siding.
People of Romoland (Demographics)
| Historical population | |||
|---|---|---|---|
| Census | Pop. | %± | |
| 2000 | 2,764 | — | |
| 2010 | 1,684 | −39.1% | |
| 2020 | 2,005 | 19.1% | |
| U.S. Decennial Census | |||
This section tells us about the people who live in Romoland. It includes information like how many people live there and their backgrounds.
2020 Population Data
The 2020 United States Census counted 2,005 people living in Romoland. This means there were about 758 people per square mile.
- Racial Makeup:
- White: 751 people (37.4%)
- Black or African American: 97 people (4.8%)
- Native American: 39 people (1.9%)
- Asian: 71 people (3.5%)
- Pacific Islander: 8 people (0.4%)
- Other races: 682 people (34.0%)
- Two or more races: 357 people (17.8%)
- Hispanic or Latino: 1,173 people (58.5%) were Hispanic or Latino.
The census also reported that the average income for households in Romoland was $90,185. About 20.6% of the people lived below the poverty line. This means their income was below a certain level set by the government.
2010 Population Data
In the 2010 United States Census, Romoland had a population of 1,684 people. The population density was about 637 people per square mile.
- Racial Makeup:
- White: 958 people (56.9%)
- African American: 65 people (3.9%)
- Native American: 8 people (0.5%)
- Asian: 35 people (2.1%)
- Pacific Islander: 12 people (0.7%)
- Other races: 514 people (30.5%)
- Two or more races: 92 people (5.5%)
- Hispanic or Latino: 865 people (51.4%) were Hispanic or Latino.
All the people counted lived in homes. No one lived in group homes or institutions.
Households and Families
There were 455 households in Romoland in 2010.
- 232 households (51.0%) had children under 18.
- 287 households (63.1%) were married couples.
- 46 households (10.1%) had a female head of household with no husband.
- 34 households (7.5%) had a male head of household with no wife.
- The average household had 3.70 people.
- There were 367 families (80.7% of households). The average family size was 4.07 people.
Age Distribution
The ages of people in Romoland in 2010 were:
- Under 18: 502 people (29.8%)
- 18 to 24: 221 people (13.1%)
- 25 to 44: 395 people (23.5%)
- 45 to 64: 434 people (25.8%)
- 65 or older: 132 people (7.8%)
The median age was 32.0 years. This means half the people were younger than 32, and half were older.
Housing
There were 512 housing units in 2010.
- 351 homes (77.1%) were owned by the people living in them.
- 104 homes (22.9%) were rented.
- Most people (76.5%) lived in homes they owned. The rest (23.5%) lived in rented homes.
See also
 In Spanish: Romoland (California) para niños
 | Anna J. Cooper |
 | Mary McLeod Bethune |
 | Lillie Mae Bradford |


