Rosebud, Missouri facts for kids
Quick facts for kids
Rosebud, Missouri
|
|
|---|---|

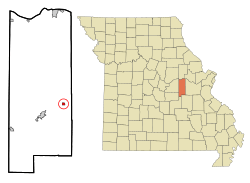
Location of Rosebud, Missouri
|
|
| Country | United States |
| State | Missouri |
| County | Gasconade |
| Government | |
| • Type | Mayor / Council |
| Area | |
| • Total | 0.88 sq mi (2.26 km2) |
| • Land | 0.87 sq mi (2.26 km2) |
| • Water | 0.00 sq mi (0.01 km2) |
| Elevation | 869 ft (265 m) |
| Population
(2020)
|
|
| • Total | 390 |
| • Density | 447.76/sq mi (172.94/km2) |
| Time zone | UTC-6 (Central (CST)) |
| • Summer (DST) | UTC-5 (CDT) |
| ZIP code |
63091
|
| Area code(s) | 573 |
| FIPS code | 29-63110 |
| GNIS feature ID | 2396431 |
Rosebud is a small city located in Gasconade County, Missouri, in the United States. A city is a place where many people live and work, often with its own local government. In 2020, about 390 people lived in Rosebud.
Contents
Where is Rosebud Located?
Rosebud is found in the state of Missouri. The city covers a total area of about 0.87 square miles (2.26 square kilometers). All of this area is land, meaning there are no large lakes or rivers within the city limits.
What is the Climate Like in Rosebud?
Rosebud has a humid subtropical climate. This means it usually has hot, humid summers and mild winters. Sometimes, the weather can be very extreme.
Temperature Extremes in Rosebud
The hottest temperature ever recorded in Rosebud was 107°F (42°C). This happened on August 30, 1984. The coldest temperature recorded was -26°F (-32°C) on January 7, 2014.
| Climate data for Rosebud, Missouri, 1991–2020 normals, extremes 1980–present | |||||||||||||
|---|---|---|---|---|---|---|---|---|---|---|---|---|---|
| Month | Jan | Feb | Mar | Apr | May | Jun | Jul | Aug | Sep | Oct | Nov | Dec | Year |
| Record high °F (°C) | 74 (23) |
82 (28) |
91 (33) |
94 (34) |
96 (36) |
106 (41) |
105 (41) |
107 (42) |
101 (38) |
93 (34) |
84 (29) |
77 (25) |
107 (42) |
| Mean maximum °F (°C) | 65.2 (18.4) |
70.5 (21.4) |
78.0 (25.6) |
84.3 (29.1) |
87.0 (30.6) |
91.7 (33.2) |
96.5 (35.8) |
96.9 (36.1) |
91.5 (33.1) |
85.1 (29.5) |
76.0 (24.4) |
66.5 (19.2) |
96.9 (36.1) |
| Mean daily maximum °F (°C) | 39.8 (4.3) |
45.0 (7.2) |
55.0 (12.8) |
66.3 (19.1) |
74.6 (23.7) |
82.8 (28.2) |
87.4 (30.8) |
86.6 (30.3) |
79.3 (26.3) |
68.1 (20.1) |
55.0 (12.8) |
43.9 (6.6) |
65.3 (18.5) |
| Daily mean °F (°C) | 28.9 (−1.7) |
33.0 (0.6) |
42.4 (5.8) |
52.9 (11.6) |
62.4 (16.9) |
71.1 (21.7) |
75.5 (24.2) |
73.9 (23.3) |
65.8 (18.8) |
54.5 (12.5) |
42.7 (5.9) |
33.1 (0.6) |
53.0 (11.7) |
| Mean daily minimum °F (°C) | 18.0 (−7.8) |
21.1 (−6.1) |
29.9 (−1.2) |
39.6 (4.2) |
50.2 (10.1) |
59.5 (15.3) |
63.5 (17.5) |
61.3 (16.3) |
52.3 (11.3) |
41.0 (5.0) |
30.5 (−0.8) |
22.3 (−5.4) |
40.8 (4.9) |
| Mean minimum °F (°C) | −2.2 (−19.0) |
3.1 (−16.1) |
11.8 (−11.2) |
25.8 (−3.4) |
34.6 (1.4) |
47.6 (8.7) |
53.9 (12.2) |
51.0 (10.6) |
37.3 (2.9) |
25.9 (−3.4) |
15.8 (−9.0) |
4.8 (−15.1) |
−5.4 (−20.8) |
| Record low °F (°C) | −26 (−32) |
−16 (−27) |
−4 (−20) |
17 (−8) |
20 (−7) |
40 (4) |
48 (9) |
36 (2) |
27 (−3) |
17 (−8) |
1 (−17) |
−23 (−31) |
−26 (−32) |
| Average precipitation inches (mm) | 2.69 (68) |
2.40 (61) |
3.67 (93) |
4.84 (123) |
5.58 (142) |
4.48 (114) |
3.94 (100) |
3.94 (100) |
4.01 (102) |
3.37 (86) |
3.58 (91) |
2.69 (68) |
45.19 (1,148) |
| Average snowfall inches (cm) | 4.2 (11) |
3.5 (8.9) |
1.7 (4.3) |
0.0 (0.0) |
0.0 (0.0) |
0.0 (0.0) |
0.0 (0.0) |
0.0 (0.0) |
0.0 (0.0) |
0.0 (0.0) |
1.5 (3.8) |
3.3 (8.4) |
14.2 (36.4) |
| Average extreme snow depth inches (cm) | 3.8 (9.7) |
2.8 (7.1) |
2.5 (6.4) |
0.0 (0.0) |
0.0 (0.0) |
0.0 (0.0) |
0.0 (0.0) |
0.0 (0.0) |
0.0 (0.0) |
0.0 (0.0) |
0.7 (1.8) |
3.6 (9.1) |
5.0 (13) |
| Average precipitation days (≥ 0.01 in) | 8.1 | 8.3 | 11.2 | 11.5 | 12.7 | 10.7 | 8.8 | 8.2 | 8.0 | 8.8 | 8.5 | 8.8 | 113.6 |
| Average snowy days (≥ 0.1 in) | 3.4 | 2.6 | 1.0 | 0.0 | 0.0 | 0.0 | 0.0 | 0.0 | 0.0 | 0.0 | 0.8 | 2.6 | 10.4 |
| Source 1: NOAA | |||||||||||||
| Source 2: National Weather Service | |||||||||||||
Who Lives in Rosebud?
The number of people living in Rosebud has changed over the years. In 1930, there were 162 people. By 2020, the population had grown to 390.
| Historical population | |||
|---|---|---|---|
| Census | Pop. | %± | |
| 1930 | 162 | — | |
| 1940 | 193 | 19.1% | |
| 1950 | 254 | 31.6% | |
| 1960 | 288 | 13.4% | |
| 1970 | 305 | 5.9% | |
| 1980 | 326 | 6.9% | |
| 1990 | 380 | 16.6% | |
| 2000 | 364 | −4.2% | |
| 2010 | 409 | 12.4% | |
| 2020 | 390 | −4.6% | |
| U.S. Decennial Census | |||
Population Details from 2010
In 2010, a study called the census counted 409 people living in Rosebud. These people lived in 179 different homes. About 107 of these homes were families.
- Most people (97.1%) in Rosebud were White.
- A small number of people were Native American (0.2%) or Asian (1.0%).
- Some people (1.7%) were Hispanic or Latino.
Households and Families
- About 26.8% of homes had children under 18 living there.
- Nearly half (47.5%) of homes were married couples living together.
- About 34.1% of all homes had just one person living there.
- About 15.1% of homes had someone 65 years or older living alone.
Age and Gender in Rosebud
The average age of people in Rosebud in 2010 was 43.2 years old.
- 22.7% of residents were under 18.
- 19.3% of residents were 65 or older.
- The city had slightly more females (52.6%) than males (47.4%).
See also
 In Spanish: Rosebud (Misuri) para niños
 | Jackie Robinson |
 | Jack Johnson |
 | Althea Gibson |
 | Arthur Ashe |
 | Muhammad Ali |

