Rothsay, Minnesota facts for kids
Quick facts for kids
Rothsay
|
|
|---|---|
 |
|
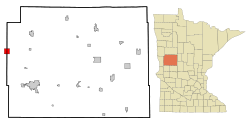
Location of Rothsay, Minnesota
|
|
| Country | United States |
| State | Minnesota |
| Counties | Wilkin, Otter Tail |
| Area | |
| • Total | 0.86 sq mi (2.22 km2) |
| • Land | 0.86 sq mi (2.22 km2) |
| • Water | 0.00 sq mi (0.00 km2) |
| Elevation | 1,188 ft (362 m) |
| Population
(2020)
|
|
| • Total | 498 |
| • Estimate
(2021)
|
491 |
| • Density | 580.42/sq mi (224.14/km2) |
| Time zone | UTC-6 (CST) |
| • Summer (DST) | UTC-5 (CDT) |
| ZIP code |
56579
|
| Area code(s) | 218 |
| FIPS code | 27-56014 |
| GNIS feature ID | 2396439 |
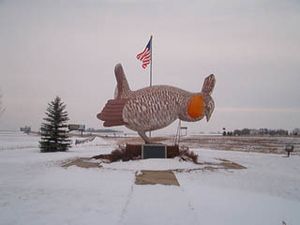
Rothsay is a small city located in the state of Minnesota, USA. It's special because it's in two different counties: Otter Tail and Wilkin. In 2020, about 498 people lived there. One of the most famous things in Rothsay is a huge statue of a prairie chicken, which is a type of bird. This statue is a big tourist attraction.
The part of Rothsay in Otter Tail County is near Fergus Falls. The part in Wilkin County is near Wahpeton, North Dakota.
Contents
History of Rothsay
A post office opened in Rothsay in 1880. The city got its name from a place called Rothesay in Scotland.
One important historical building in Rothsay is the 1903 J. A. Johnson Blacksmith Shop. This building is listed on the National Register of Historic Places. This means it's a special place recognized for its history.
Geography and Location
Rothsay covers a total area of about 0.88 square miles (2.22 square kilometers). All of this area is land.
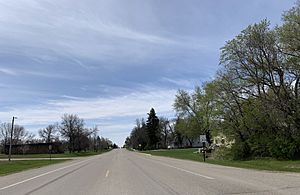
Major roads in the city include Interstate Highway 94/US Highway 52, Center Street, and Main Avenue. These roads help people travel in and out of the city.
Understanding Rothsay's Climate
Rothsay experiences a range of weather throughout the year. The climate data below shows the average temperatures and precipitation.
| Climate data for Rothsay, Minnesota (1991–2020 normals, extremes 1959–present) | |||||||||||||
|---|---|---|---|---|---|---|---|---|---|---|---|---|---|
| Month | Jan | Feb | Mar | Apr | May | Jun | Jul | Aug | Sep | Oct | Nov | Dec | Year |
| Record high °F (°C) | 55 (13) |
56 (13) |
81 (27) |
98 (37) |
97 (36) |
99 (37) |
102 (39) |
105 (41) |
99 (37) |
95 (35) |
77 (25) |
56 (13) |
105 (41) |
| Mean daily maximum °F (°C) | 18.2 (−7.7) |
23.0 (−5.0) |
36.3 (2.4) |
52.7 (11.5) |
66.9 (19.4) |
75.8 (24.3) |
80.0 (26.7) |
78.4 (25.8) |
70.3 (21.3) |
54.7 (12.6) |
38.0 (3.3) |
24.1 (−4.4) |
51.5 (10.8) |
| Daily mean °F (°C) | 8.7 (−12.9) |
12.8 (−10.7) |
26.8 (−2.9) |
42.0 (5.6) |
56.1 (13.4) |
66.1 (18.9) |
70.0 (21.1) |
68.3 (20.2) |
59.5 (15.3) |
44.8 (7.1) |
29.4 (−1.4) |
15.6 (−9.1) |
41.7 (5.4) |
| Mean daily minimum °F (°C) | −0.9 (−18.3) |
2.6 (−16.3) |
17.2 (−8.2) |
31.3 (−0.4) |
45.2 (7.3) |
56.4 (13.6) |
60.0 (15.6) |
58.1 (14.5) |
48.8 (9.3) |
35.0 (1.7) |
20.9 (−6.2) |
7.1 (−13.8) |
31.8 (−0.1) |
| Record low °F (°C) | −39 (−39) |
−37 (−38) |
−26 (−32) |
−5 (−21) |
18 (−8) |
32 (0) |
40 (4) |
35 (2) |
20 (−7) |
10 (−12) |
−21 (−29) |
−34 (−37) |
−39 (−39) |
| Average precipitation inches (mm) | 0.75 (19) |
0.63 (16) |
1.08 (27) |
2.06 (52) |
3.27 (83) |
3.93 (100) |
3.43 (87) |
2.72 (69) |
2.75 (70) |
2.34 (59) |
0.92 (23) |
0.89 (23) |
24.77 (629) |
| Average snowfall inches (cm) | 11.4 (29) |
7.7 (20) |
7.2 (18) |
4.1 (10) |
0.0 (0.0) |
0.0 (0.0) |
0.0 (0.0) |
0.0 (0.0) |
0.0 (0.0) |
1.6 (4.1) |
6.9 (18) |
10.7 (27) |
49.6 (126) |
| Average precipitation days (≥ 0.01 in) | 5.5 | 5.5 | 6.3 | 6.9 | 10.2 | 11.5 | 10.1 | 8.3 | 8.7 | 8.5 | 4.7 | 7.0 | 93.2 |
| Average snowy days (≥ 0.1 in) | 6.5 | 5.1 | 3.7 | 1.2 | 0.0 | 0.0 | 0.0 | 0.0 | 0.0 | 0.8 | 2.5 | 7.1 | 26.9 |
| Source: NOAA | |||||||||||||
Population and People
The population of Rothsay has changed over the years. Here's a look at how many people have lived there since 1890:
| Historical population | |||
|---|---|---|---|
| Census | Pop. | %± | |
| 1890 | 174 | — | |
| 1900 | 296 | 70.1% | |
| 1910 | 343 | 15.9% | |
| 1920 | 398 | 16.0% | |
| 1930 | 386 | −3.0% | |
| 1940 | 415 | 7.5% | |
| 1950 | 537 | 29.4% | |
| 1960 | 457 | −14.9% | |
| 1970 | 448 | −2.0% | |
| 1980 | 476 | 6.3% | |
| 1990 | 433 | −9.0% | |
| 2000 | 497 | 14.8% | |
| 2010 | 493 | −0.8% | |
| 2020 | 498 | 1.0% | |
| 2021 (est.) | 491 | −0.4% | |
| U.S. Decennial Census 2020 Census |
|||
Rothsay's Community in 2010
In 2010, there were 493 people living in Rothsay. These people lived in 211 households, and 140 of these were families.
Most of the people in Rothsay were White (98.8%). A small number were Native American (0.8%) or Asian (0.4%). About 0.2% of the population identified as Hispanic or Latino.
Out of the 211 households, about 32.7% had children under 18 living there. Nearly half (49.8%) were married couples. Some households (9.5%) had a female head without a husband, and 7.1% had a male head without a wife. About 28.4% of households were individuals living alone.
The average age of people in the city was 37.1 years old. About 25.8% of residents were under 18. People aged 25 to 44 made up 28.8% of the population. About 15.8% of residents were 65 years old or older. Slightly more than half of the population (51.3%) was male, and 48.7% was female.
See also
 In Spanish: Rothsay (Minnesota) para niños
 | May Edward Chinn |
 | Rebecca Cole |
 | Alexa Canady |
 | Dorothy Lavinia Brown |


