South Gifford, Missouri facts for kids
Quick facts for kids
South Gifford, Missouri
|
|
|---|---|
|
Village
|
|

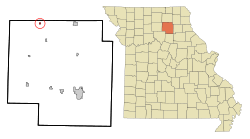
Location in Macon County and the state of Missouri
|
|
| Country | United States |
| State | Missouri |
| County | Macon |
| Area | |
| • Total | 0.21 sq mi (0.53 km2) |
| • Land | 0.20 sq mi (0.53 km2) |
| • Water | 0.00 sq mi (0.00 km2) |
| Population
(2020)
|
|
| • Total | 22 |
| • Density | 107.32/sq mi (41.53/km2) |
| Time zone | UTC-6 (Central (CST)) |
| • Summer (DST) | UTC-5 (CDT) |
| ZIP code |
63549 (La Plata)
|
| Area code(s) | 660 |
| FIPS code | 29-68852 |
South Gifford is a small village located in Macon County, Missouri, in the United States. In 2020, about 22 people lived here. This number was lower than in 2010, when 50 people called South Gifford home.
Contents
The Story of South Gifford
South Gifford began in the early 1900s. It started growing when a railroad line was built through the area. A post office opened in South Gifford in 1913. It served the community for many years before closing in 1971.
Where is South Gifford?
South Gifford is in the northern part of Macon County. You can find it at these coordinates: 40°1′31″N 92°40′56″W / 40.02528°N 92.68222°W. Missouri Route 156 goes right through the middle of the village. If you travel east on this road for about 10 miles, you will reach La Plata. Going west for about 4 miles will take you to Route 149.
The village covers a total area of about 0.21 square miles (0.53 square kilometers). Most of this area is land. Only a tiny part, about 0.001 square miles, is water. The Chariton River, which flows south towards the Missouri River, is located just west of South Gifford.
How Many People Live Here?
| Historical population | |||
|---|---|---|---|
| Census | Pop. | %± | |
| 1910 | 148 | — | |
| 1920 | 168 | 13.5% | |
| 1930 | 181 | 7.7% | |
| 1940 | 163 | −9.9% | |
| 1950 | 128 | −21.5% | |
| 1960 | 93 | −27.3% | |
| 1970 | 64 | −31.2% | |
| 1980 | 98 | 53.1% | |
| 1990 | 64 | −34.7% | |
| 2000 | 72 | 12.5% | |
| 2010 | 50 | −30.6% | |
| 2020 | 22 | −56.0% | |
| U.S. Decennial Census | |||
South Gifford in 2010
According to the census from 2010, there were 50 people living in South Gifford. These people lived in 19 different homes, and 13 of these were families.
Most of the people living in the village (98%) were White. A small number (2%) were from two or more different backgrounds.
Out of the 19 homes, about 31.6% had kids under 18 living there. Most homes (63.2%) were married couples living together. About 15.8% of the homes were people living by themselves. On average, there were about 2.63 people in each home.
The average age of people in the village was 39.5 years old. About 26% of the residents were under 18. Most people were between 45 and 64 years old (44%). There were slightly more males (54%) than females (46%) in the village.
See also
 In Spanish: South Gifford (Misuri) para niños
 | Madam C. J. Walker |
 | Janet Emerson Bashen |
 | Annie Turnbo Malone |
 | Maggie L. Walker |

