
South Miami Heights, Florida facts for kids
Quick facts for kids
South Miami Heights, Florida
|
|
|---|---|

South Miami Heights in 1972
|
|

Location in Miami-Dade County and the state of Florida
|
|

U.S. Census Bureau map showing CDP boundaries
|
|
| Country | |
| State | |
| County | |
| Area | |
| • Total | 4.98 sq mi (12.91 km2) |
| • Land | 4.91 sq mi (12.71 km2) |
| • Water | 0.08 sq mi (0.20 km2) |
| Elevation | 10 ft (3 m) |
| Population
(2020)
|
|
| • Total | 36,770 |
| • Density | 7,491.85/sq mi (2,892.74/km2) |
| Time zone | UTC-5 (Eastern (EST)) |
| • Summer (DST) | UTC-4 (EDT) |
| ZIP codes |
33157, 33177, 33189 (Miami)
|
| Area code(s) | 305, 786, 645 |
| FIPS code | 12-67575 |
| GNIS feature ID | 0291396 |
South Miami Heights is a special kind of community in Miami-Dade County, Florida. It's called a census-designated place (CDP). This means it's an area identified by the government for counting people, but it's not officially a city with its own local government. It was once known as Eureka.
South Miami Heights is part of the larger Miami metropolitan area in South Florida. In 2020, about 36,770 people lived there.
Contents
Where is South Miami Heights?
South Miami Heights is located about 17 miles southwest of downtown Miami. You can find it at these coordinates: 25°35′20″N 80°23′7″W / 25.58889°N 80.38528°W.
It shares borders with several other communities:
- To the east is Cutler Bay.
- To the south is Goulds.
- To the northwest is Richmond West.
- To the northeast is West Perrine.
Also, to the north of South Miami Heights, you'll find Thompson Memorial Park and Zoo Miami.
Land and Water Area
According to the United States Census Bureau, South Miami Heights covers a total area of about 5.0 square miles. Most of this area, about 4.91 square miles, is land. A small part, about 0.08 square miles, is water.
How Many People Live Here?
The number of people living in South Miami Heights has grown over the years. Here's a quick look at the population counts from different census years:
| Historical population | |||
|---|---|---|---|
| Census | Pop. | %± | |
| 1970 | 10,395 | — | |
| 1980 | 23,559 | 126.6% | |
| 1990 | 30,030 | 27.5% | |
| 2000 | 33,522 | 11.6% | |
| 2010 | 35,696 | 6.5% | |
| 2020 | 36,770 | 3.0% | |
| source: | |||
Who Lives in South Miami Heights?
The U.S. Census helps us understand the different groups of people living in South Miami Heights. It looks at both race and ethnicity. It's important to know that "Hispanic/Latino" is an ethnic group, and people from any race can be Hispanic or Latino.
Here's a summary of the population from the 2010 and 2020 censuses:
| Race / Ethnicity (NH = Non-Hispanic) | Pop 2010 | Pop 2020 | % 2010 | % 2020 |
|---|---|---|---|---|
| White (NH) | 2,561 | 2,119 | 7.17% | 5.76% |
| Black or African American (NH) | 7,792 | 5,285 | 21.83% | 14.37% |
| Native American or Alaska Native (NH) | 47 | 31 | 0.13% | 0.08% |
| Asian (NH) | 514 | 444 | 1.44% | 1.21% |
| Pacific Islander or Native Hawaiian (NH) | 4 | 2 | 0.01% | 0.01% |
| Some other race (NH) | 127 | 231 | 0.36% | 0.63% |
| Mixed race or Multiracial (NH) | 393 | 433 | 1.10% | 1.18% |
| Hispanic or Latino (any race) | 24,258 | 28,225 | 67.96% | 76.76% |
| Total | 35,696 | 36,770 | 100.00% | 100.00% |
In 2020, there were 36,770 people living in South Miami Heights. These people lived in 10,769 households, and 8,265 of these were families.
In 2010, there were 35,696 people. They lived in 10,558 households, and 8,485 of these were families.
Images for kids
-
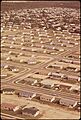
South Miami Heights in 1972
See also
 In Spanish: South Miami Heights para niños
