South Oroville, California facts for kids
Quick facts for kids
South Oroville
|
|
|---|---|

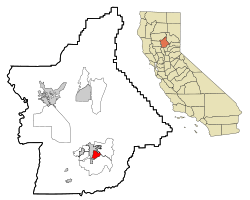
Location in Butte County and the state of California
|
|
| Country | |
| State | |
| County | Butte |
| Area | |
| • Total | 2.964 sq mi (7.678 km2) |
| • Land | 2.964 sq mi (7.678 km2) |
| • Water | 0 sq mi (0 km2) 0% |
| Elevation | 187 ft (57 m) |
| Population
(2020)
|
|
| • Total | 3,235 |
| • Density | 1,091.4/sq mi (421.33/km2) |
| Time zone | UTC-8 (PST) |
| • Summer (DST) | UTC-7 (PDT) |
| ZIP code |
95965
|
| Area code(s) | 530 |
| FIPS code | 06-73178 |
| GNIS feature ID | 1659826 |
South Oroville is a special kind of community in Butte County, California, United States. It's called a census-designated place (CDP). This means it's an area that looks like a town but isn't officially governed by its own city government. The government counts its population for statistics.
South Oroville is very close to the city of Oroville. Many people think of them as one area. South Oroville doesn't have many businesses, so its residents often go to Oroville for shopping and services. Sometimes, they even go to Chico. There isn't a clear line showing where South Oroville ends and Oroville begins. Other nearby areas like Thermalito, Oroville East, and Palermo are also very connected to Oroville.
A big school, Las Plumas High School, is located in South Oroville. Most high school students in the area go to school there.
About South Oroville
Where is South Oroville?
South Oroville is located in California. It's part of Butte County. The area covers about 3.0 square miles (7.7 square kilometers) of land. There is no water within its borders.
Who Lives Here?
In 2010, the population of South Oroville was 5,742 people. This was a decrease from 7,695 people in 2000.
The people living in South Oroville come from many different backgrounds. In 2010, about 59.3% of residents were White. About 7.1% were African American, 4.3% were Native American, and 15.4% were Asian. About 14.8% of the population identified as Hispanic or Latino.
Most people in South Oroville live in family homes. In 2010, there were 1,745 households. About 44.2% of these homes had children under 18 living there. The average household had about 3.22 people.
The population includes people of all ages. In 2010, about 30.6% of the people were under 18 years old. About 8.1% were 65 years or older. The average age of residents was 30.0 years.
Changes to the Area
Recently, the city of Oroville has officially added two parts of South Oroville to its own city limits. This process is called annexation. These two areas are known as Area A and Area B.
Area A is a more developed part of South Oroville. It has a population of 2,392 people. Area B is more rural, with larger undeveloped lands. It has a population of 333 people. Together, these annexed areas added 2,725 people to the city of Oroville.
See also
 In Spanish: South Oroville para niños
 | Frances Mary Albrier |
 | Whitney Young |
 | Muhammad Ali |


