Turbo, Colombia facts for kids
Quick facts for kids
Turbo, Colombia
|
||
|---|---|---|
 |
||
|
||
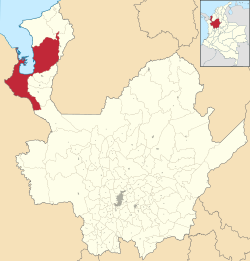
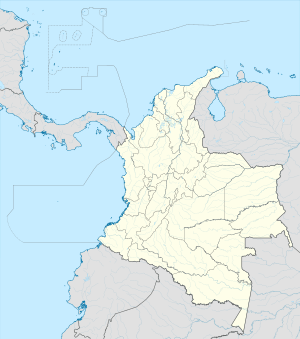
Location of the city of Turbo, in the Antioquia Department of Colombia
|
||
| Country | ||
| Department | ||
| Subregion | Urabá | |
| Area | ||
| • Metro | 3,055 km2 (1,180 sq mi) | |
| Elevation | 2 m (7 ft) | |
| Population
(2016)
|
||
| • City | 163,525 | |
| • Density | 41.25/km2 (106.8/sq mi) | |
| • Urban | 65,307 | |
| Time zone | UTC−5 (Colombia Standard Time) | |
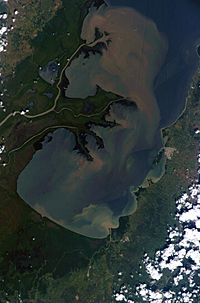
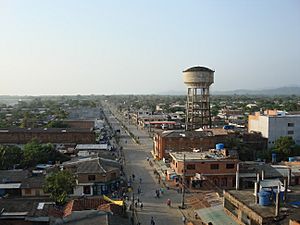
Turbo is an important port city in Antioquia Department, Colombia. It is part of the Urabá Antioquia region. The city is located right on the coast of the Gulf of Urabá. This is about 340 kilometers (211 miles) north of Medellín, which is the capital of the department.
Turbo is known as the main city of the Urabá region. The area where Turbo stands today was once called Pisisí. People started talking about "Turbo" by the year 1741. In 1839, the government spent money to build military buildings here. Turbo officially became a municipality, or a town with its own local government, in 1847.
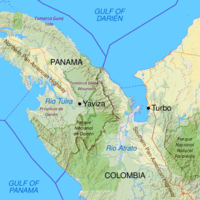
Turbo is also famous for its location near the Darién Gap. This is a large area of forests and mountains that separates North and South America. Turbo is the northern end of the main part of the Pan-American Highway in South America. This highway is a network of roads that connects most of the countries in the Americas.
There is no paved road that goes through the Darién Gap to Yaviza, Panama. This means you cannot drive directly from Turbo to Central or North America.
What is the Climate Like in Turbo?
Understanding Turbo's Weather
Turbo has a warm climate all year round. The average temperature is about 27.3°C (81.0°F). The temperature does not change much throughout the year.
The city gets a lot of rain, especially from April to November. This is because of strong winds from a weather system called the Intertropical Convergence Zone (ITCZ). However, from January to March, there is a drier season. This type of weather is called a tropical monsoon climate.
| Climate data for Turbo, elevation 37 m (121 ft), (1981–2010) | |||||||||||||
|---|---|---|---|---|---|---|---|---|---|---|---|---|---|
| Month | Jan | Feb | Mar | Apr | May | Jun | Jul | Aug | Sep | Oct | Nov | Dec | Year |
| Mean daily maximum °C (°F) | 31.0 (87.8) |
30.8 (87.4) |
30.9 (87.6) |
31.2 (88.2) |
31.7 (89.1) |
31.6 (88.9) |
31.7 (89.1) |
31.7 (89.1) |
31.9 (89.4) |
32.2 (90.0) |
31.7 (89.1) |
31.2 (88.2) |
31.5 (88.7) |
| Daily mean °C (°F) | 27.2 (81.0) |
27.2 (81.0) |
27.3 (81.1) |
27.5 (81.5) |
27.4 (81.3) |
27.5 (81.5) |
27.2 (81.0) |
27.4 (81.3) |
27.4 (81.3) |
27.3 (81.1) |
27.2 (81.0) |
27.1 (80.8) |
27.3 (81.1) |
| Mean daily minimum °C (°F) | 23.8 (74.8) |
23.9 (75.0) |
24.3 (75.7) |
24.3 (75.7) |
24.0 (75.2) |
23.8 (74.8) |
23.7 (74.7) |
23.5 (74.3) |
23.6 (74.5) |
23.4 (74.1) |
23.5 (74.3) |
23.7 (74.7) |
23.8 (74.8) |
| Average precipitation mm (inches) | 79.8 (3.14) |
50.0 (1.97) |
75.6 (2.98) |
235.2 (9.26) |
290.7 (11.44) |
252.5 (9.94) |
218.6 (8.61) |
265.1 (10.44) |
217.6 (8.57) |
184.0 (7.24) |
230.6 (9.08) |
193.9 (7.63) |
2,230.6 (87.82) |
| Average precipitation days (≥ 1.0 mm) | 5 | 5 | 7 | 13 | 17 | 15 | 16 | 17 | 15 | 14 | 14 | 10 | 140 |
| Average relative humidity (%) | 86 | 85 | 85 | 86 | 88 | 87 | 86 | 87 | 86 | 87 | 87 | 87 | 87 |
| Source: Instituto de Hidrologia Meteorologia y Estudios Ambientales | |||||||||||||
See also
 In Spanish: Turbo (Colombia) para niños
 | Isaac Myers |
 | D. Hamilton Jackson |
 | A. Philip Randolph |


