Venn diagram facts for kids
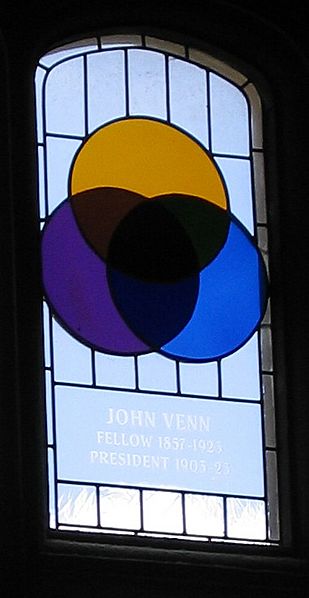
A Venn diagram is a special drawing that shows how different groups of things, called sets, are connected. These diagrams were made popular by John Venn in the 1880s. Today, people use them a lot.
Venn diagrams help teach basic set theory. They also show simple connections in probability, logic, statistics, linguistics, and computer science. A Venn diagram uses closed shapes, usually circles or ovals, to stand for each set.
Other people had similar ideas before Venn. For example, Christian Weise in 1712 and Leonhard Euler in 1768 thought of similar ways to show groups. But John Venn made the idea famous in his book Symbolic Logic in 1881.
Contents
How a Venn Diagram Works
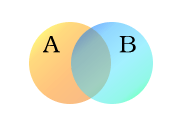
Let's look at an example with two groups, A and B. We can show these groups as colored circles. Imagine the orange circle, set A, holds all living creatures that have two legs. The blue circle, set B, holds all living creatures that can fly.
Every type of creature can be thought of as a point on the diagram. Creatures that can both fly and have two legs, like parrots, are in both groups. So, they are in the area where the blue and orange circles overlap. This overlapping part shows all creatures that fit both descriptions.
Humans and penguins have two legs, so they are in the orange circle. But they cannot fly. So, they appear in the left part of the orange circle, where it does not overlap with the blue circle. Mosquitoes have six legs and can fly. So, a mosquito would be in the part of the blue circle that does not overlap with the orange one. Creatures that don't have two legs and can't fly (like whales and spiders) would be outside both circles.
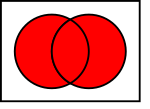
The total area covered by sets A and B together is called the union of A and B. We write this as A ∪ B. In our example, the union includes all living creatures that either have two legs, or can fly, or both.
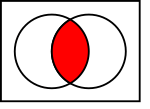
The area where A and B overlap is called the intersection of A and B. We write this as A ∩ B. For instance, the intersection of our two sets is not empty. This is because there are creatures, like parrots, that are in both the orange and blue circles.
Common Venn Diagram Operations
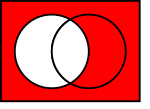
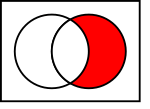
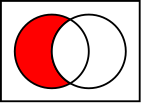
In the pictures above, the circle on the left shows set  . The circle on the right shows set
  . The colored parts show the results of different actions you can do with sets.
Related pages
Images for kids
See also
 In Spanish: Diagrama de Venn para niños
 | Valerie Thomas |
 | Frederick McKinley Jones |
 | George Edward Alcorn Jr. |
 | Thomas Mensah |


