W:Demographics of Nepal facts for kids
Quick facts for kids Demographics of Nepal |
|
|---|---|
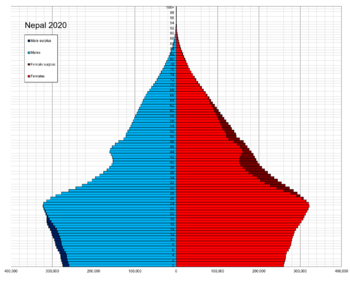
Population pyramid of Nepal in 2020
|
|
| Population | 29125600 (2021) |
| Growth rate | 0.92% |
| Birth rate | 17.53 births/1,000 population |
| Death rate | 5.58 deaths/1,000 population |
| Life expectancy | 72.4 years |
| • male | 71.66 years |
| • female | 73.17 years |
| Fertility rate | 1.9 children |
| Infant mortality rate | 25.13 deaths/1,000 live births |
| Net migration rate | -4.21 migrant(s)/1,000 population |
| Age structure | |
| 0–14 years | 28.41% |
| 15–64 years | 65.69% |
| 65 and over | 5.90% |
| Sex ratio | |
| Total | 0.96 male(s)/female (2022 est.) |
| At birth | 1.06 male(s)/female |
| Nationality | |
| Nationality | Nepali |
| Language | |
| Official | Nepali |
Nepal's population was about 29.1 million people in 2021. This number comes from the latest census. The population grows by about 0.92% each year.
In 2011, Nepal had around 26 million people. The population was growing faster then, at 1.35% per year. The average age of people in Nepal was about 21.6 years old. By 2016, the average age for females was about 25 years, and for males, it was about 22 years.
Most people in Nepal are between 15 and 64 years old (about 61%). Around 34.6% of the population is younger than 14 years. Only a small part, about 4.4%, is older than 65 years.
In 2011, about 22 babies were born for every 1,000 people. Sadly, 46 babies out of every 1,000 live births did not survive their first year. This number was a bit lower than in 2006. Infant mortality is higher in rural areas because there are fewer hospitals and clinics.
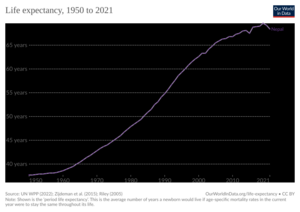
People in Nepal live for about 72.4 years on average. Females tend to live a bit longer (73.17 years) than males (71.66 years).
About 65.9% of people in Nepal could read and write in 2011. This means they are literate.
Contents
How Nepal's Population Has Grown
| Historical population | ||
|---|---|---|
| Year | Pop. | ±% |
| 0 | 1,000,000 | — |
| 1000 | 1,500,000 | +50.0% |
| 1500 | 2,000,000 | +33.3% |
| 1600 | 2,500,000 | +25.0% |
| 1700 | 3,000,000 | +20.0% |
| 1800 | 4,000,000 | +33.3% |
| 1911 | 5,638,749 | +41.0% |
| 1920 | 5,573,788 | −1.2% |
| 1930 | 5,532,574 | −0.7% |
| 1941 | 6,283,649 | +13.6% |
| 1954 | 8,256,625 | +31.4% |
| 1961 | 9,412,996 | +14.0% |
| 1971 | 11,555,983 | +22.8% |
| 1981 | 15,022,839 | +30.0% |
| 1991 | 18,491,097 | +23.1% |
| 2001 | 23,151,423 | +25.2% |
| 2011 | 26,494,504 | +14.4% |
| 2021 | 29,164,578 | +10.1% |
| Source: | ||
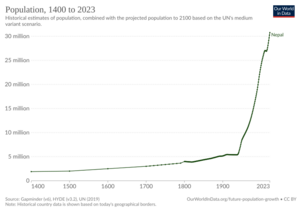
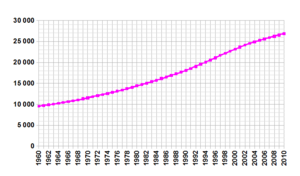
Nepal's population has been growing steadily for many years. In 2001, there were about 23 million people. By 2011, it had grown to 26 million. The population is now around 30 million. This means about 3 million more people every five years.
Over time, many different groups of people have moved to Nepal from places like Tibet and India. This has created over sixty different groups based on their family background and language. In the past, Nepal's population stayed mostly the same for over a hundred years.
In the 1950s, natural disasters caused many people to move from the hills to the Terai region. The Western Chitwan Valley became a major transport area in the 1980s. This led to more government services, businesses, and jobs, especially in farming. The population in this valley grew quickly.
Important Numbers About People
UN Estimates of Population Changes
This table shows how Nepal's population has changed over many years. It includes how many babies were born, how many people died, and how many children women had on average.
| Year | Nos. in year | Rates per 1000 | Total fertility rate |
Infant mortality rate per 1000 |
Life expectancy (years) |
||||
|---|---|---|---|---|---|---|---|---|---|
| Live births | Deaths | Natural change |
Crude birth rate |
Crude death rate |
Natural change |
||||
| 1950 | 395,000 | 218,000 | 177,000 | 47.1 | 26.0 | 21.1 | 6.00 | 226.7 | 37.68 |
| 1951 | 404,000 | 222,000 | 181,000 | 47.0 | 25.9 | 21.1 | 6.02 | 226.0 | 37.75 |
| 1952 | 411,000 | 226,000 | 185,000 | 46.9 | 25.8 | 21.1 | 6.03 | 225.4 | 37.84 |
| 1953 | 418,000 | 231,000 | 187,000 | 46.7 | 25.8 | 20.9 | 6.04 | 225.0 | 37.87 |
| 1954 | 424,000 | 235,000 | 189,000 | 46.4 | 25.7 | 20.7 | 6.04 | 224.6 | 37.90 |
| 1955 | 428,000 | 238,000 | 190,000 | 46.1 | 25.6 | 20.5 | 6.03 | 224.0 | 37.98 |
| 1956 | 433,000 | 241,000 | 192,000 | 45.8 | 25.5 | 20.3 | 6.02 | 223.2 | 38.05 |
| 1957 | 438,000 | 244,000 | 194,000 | 45.4 | 25.3 | 20.1 | 6.01 | 222.2 | 38.14 |
| 1958 | 444,000 | 248,000 | 196,000 | 45.2 | 25.2 | 20.0 | 6.00 | 221.1 | 38.19 |
| 1959 | 449,000 | 250,000 | 199,000 | 44.9 | 25.0 | 19.9 | 5.99 | 219.4 | 38.41 |
| 1960 | 458,000 | 253,000 | 206,000 | 45.1 | 24.9 | 20.2 | 6.03 | 217.1 | 38.56 |
| 1961 | 468,000 | 255,000 | 213,000 | 45.1 | 24.6 | 20.5 | 6.06 | 214.4 | 38.86 |
| 1962 | 476,000 | 258,000 | 218,000 | 45.0 | 24.4 | 20.6 | 6.08 | 211.2 | 39.15 |
| 1963 | 483,000 | 260,000 | 223,000 | 44.8 | 24.1 | 20.7 | 6.07 | 207.5 | 39.45 |
| 1964 | 492,000 | 260,000 | 231,000 | 44.7 | 23.7 | 21.0 | 6.07 | 203.1 | 39.99 |
| 1965 | 498,000 | 261,000 | 237,000 | 44.3 | 23.3 | 21.1 | 6.03 | 198.7 | 40.45 |
| 1966 | 505,000 | 262,000 | 243,000 | 44.0 | 22.9 | 21.2 | 6.00 | 194.2 | 40.87 |
| 1967 | 513,000 | 263,000 | 251,000 | 43.8 | 22.4 | 21.4 | 5.98 | 189.7 | 41.40 |
| 1968 | 523,000 | 264,000 | 259,000 | 43.7 | 22.1 | 21.6 | 5.97 | 185.5 | 41.80 |
| 1969 | 529,000 | 264,000 | 265,000 | 43.3 | 21.6 | 21.7 | 5.91 | 181.1 | 42.33 |
| 1970 | 537,000 | 265,000 | 272,000 | 43.0 | 21.2 | 21.8 | 5.88 | 177.1 | 42.83 |
| 1971 | 546,000 | 265,000 | 280,000 | 42.7 | 20.8 | 21.9 | 5.84 | 172.9 | 43.31 |
| 1972 | 551,000 | 267,000 | 284,000 | 42.2 | 20.4 | 21.8 | 5.78 | 169.1 | 43.69 |
| 1973 | 554,000 | 268,000 | 287,000 | 41.6 | 20.1 | 21.5 | 5.69 | 165.5 | 44.04 |
| 1974 | 568,000 | 269,000 | 299,000 | 41.7 | 19.7 | 22.0 | 5.74 | 161.9 | 44.46 |
| 1975 | 579,000 | 269,000 | 310,000 | 41.6 | 19.3 | 22.3 | 5.75 | 158.2 | 45.04 |
| 1976 | 592,000 | 270,000 | 322,000 | 41.6 | 19.0 | 22.6 | 5.75 | 154.6 | 45.54 |
| 1977 | 601,000 | 271,000 | 330,000 | 41.3 | 18.6 | 22.7 | 5.73 | 150.9 | 46.01 |
| 1978 | 614,000 | 270,000 | 344,000 | 41.2 | 18.1 | 23.1 | 5.72 | 147.0 | 46.68 |
| 1979 | 625,000 | 270,000 | 355,000 | 41.0 | 17.7 | 23.3 | 5.69 | 142.9 | 47.27 |
| 1980 | 632,000 | 269,000 | 363,000 | 40.5 | 17.2 | 23.3 | 5.64 | 139.0 | 47.89 |
| 1981 | 645,000 | 269,000 | 375,000 | 40.4 | 16.9 | 23.5 | 5.60 | 135.4 | 48.39 |
| 1982 | 658,000 | 269,000 | 388,000 | 40.2 | 16.5 | 23.7 | 5.58 | 130.9 | 48.94 |
| 1983 | 672,000 | 270,000 | 401,000 | 40.1 | 16.1 | 24.0 | 5.56 | 126.8 | 49.43 |
| 1984 | 686,000 | 268,000 | 418,000 | 40.0 | 15.6 | 24.4 | 5.54 | 122.7 | 50.23 |
| 1985 | 695,000 | 266,000 | 429,000 | 39.6 | 15.2 | 24.4 | 5.47 | 118.6 | 50.88 |
| 1986 | 706,000 | 264,000 | 441,000 | 39.3 | 14.7 | 24.6 | 5.42 | 114.3 | 51.54 |
| 1987 | 717,000 | 259,000 | 457,000 | 39.0 | 14.1 | 24.9 | 5.36 | 110.2 | 52.48 |
| 1988 | 726,000 | 258,000 | 469,000 | 38.7 | 13.7 | 25.0 | 5.31 | 105.7 | 53.07 |
| 1989 | 735,000 | 251,000 | 484,000 | 38.3 | 13.1 | 25.3 | 5.25 | 101.0 | 54.13 |
| 1990 | 748,000 | 248,000 | 499,000 | 38.1 | 12.7 | 25.5 | 5.21 | 96.5 | 54.83 |
| 1991 | 757,000 | 244,000 | 513,000 | 37.6 | 12.1 | 25.5 | 5.14 | 92.1 | 55.71 |
| 1992 | 768,000 | 239,000 | 529,000 | 37.1 | 11.6 | 25.6 | 5.04 | 87.6 | 56.71 |
| 1993 | 791,000 | 236,000 | 555,000 | 37.1 | 11.1 | 26.1 | 5.00 | 83.8 | 57.62 |
| 1994 | 795,000 | 230,000 | 565,000 | 36.4 | 10.5 | 25.9 | 4.91 | 79.4 | 58.55 |
| 1995 | 797,000 | 226,000 | 571,000 | 35.6 | 10.1 | 25.5 | 4.79 | 75.6 | 59.32 |
| 1996 | 787,000 | 222,000 | 565,000 | 34.5 | 9.7 | 24.7 | 4.60 | 72.1 | 59.98 |
| 1997 | 773,000 | 216,000 | 557,000 | 33.2 | 9.3 | 23.9 | 4.39 | 68.3 | 60.77 |
| 1998 | 768,000 | 210,000 | 558,000 | 32.3 | 8.8 | 23.5 | 4.24 | 65.2 | 61.55 |
| 1999 | 760,000 | 207,000 | 553,000 | 31.4 | 8.5 | 22.8 | 4.08 | 61.8 | 62.11 |
| 2000 | 754,000 | 204,000 | 550,000 | 30.6 | 8.3 | 22.3 | 3.94 | 58.7 | 62.61 |
| 2001 | 739,000 | 199,000 | 540,000 | 29.5 | 7.9 | 21.6 | 3.76 | 55.8 | 63.34 |
| 2002 | 724,000 | 202,000 | 522,000 | 28.5 | 8.0 | 20.5 | 3.59 | 53.2 | 63.26 |
| 2003 | 719,000 | 196,000 | 523,000 | 27.9 | 7.6 | 20.3 | 3.46 | 50.5 | 64.20 |
| 2004 | 707,000 | 192,000 | 515,000 | 27.1 | 7.4 | 19.7 | 3.31 | 48.1 | 64.82 |
| 2005 | 687,000 | 188,000 | 499,000 | 26.0 | 7.1 | 18.9 | 3.14 | 46.0 | 65.46 |
| 2006 | 666,000 | 187,000 | 479,000 | 25.0 | 7.0 | 18.0 | 2.97 | 44.1 | 65.87 |
| 2007 | 650,000 | 185,000 | 465,000 | 24.2 | 6.9 | 17.3 | 2.84 | 42.2 | 66.33 |
| 2008 | 637,000 | 188,000 | 449,000 | 23.6 | 6.9 | 16.6 | 2.72 | 40.1 | 66.42 |
| 2009 | 625,000 | 187,000 | 438,000 | 23.0 | 6.9 | 16.1 | 2.60 | 38.3 | 66.76 |
| 2010 | 617,000 | 191,000 | 426,000 | 22.6 | 7.0 | 15.6 | 2.51 | 36.7 | 66.81 |
| 2011 | 614,000 | 189,000 | 425,000 | 22.4 | 6.9 | 15.5 | 2.44 | 35.1 | 67.31 |
| 2012 | 615,000 | 192,000 | 423,000 | 22.3 | 7.0 | 15.4 | 2.39 | 33.7 | 67.47 |
| 2013 | 613,000 | 190,000 | 423,000 | 22.2 | 6.9 | 15.4 | 2.33 | 32.2 | 67.97 |
| 2014 | 614,000 | 193,000 | 421,000 | 22.2 | 7.0 | 15.2 | 2.29 | 30.6 | 68.09 |
| 2015 | 611,000 | 204,000 | 407,000 | 22.1 | 7.4 | 14.7 | 2.25 | 29.6 | 67.46 |
| 2016 | 607,000 | 193,000 | 414,000 | 21.8 | 6.9 | 14.8 | 2.20 | 27.7 | 68.78 |
| 2017 | 603,000 | 197,000 | 407,000 | 21.4 | 7.0 | 14.4 | 2.15 | 26.6 | 68.91 |
| 2018 | 600,000 | 201,000 | 399,000 | 21.0 | 7.0 | 14.0 | 2.10 | 25.5 | 68.98 |
| 2019 | 602,000 | 198,000 | 404,000 | 20.9 | 6.9 | 14.0 | 2.08 | 24.5 | 69.56 |
| 2020 | 603,000 | 210,000 | 392,000 | 20.6 | 7.2 | 13.4 | 2.06 | 23.8 | 69.25 |
| 2021 | 610,000 | 232,000 | 377,000 | 20.4 | 7.8 | 12.6 | 2.03 | 22.8 | 68.45 |
CBR = crude birth rate (babies born per 1000 people); CDR = crude death rate (deaths per 1000 people); NC = natural change (population change per 1000 people); TFR = total fertility rate (average number of children per woman); IMR = infant mortality rate (babies who die per 1000 live births).
Source: UN DESA, World Population Prospects, 2022
Life Expectancy in Nepal
Life expectancy is how long people are expected to live on average. In Nepal, this number has increased a lot over the years.
| Period | Life expectancy in years |
Period | Life expectancy in years |
|---|---|---|---|
| 1950–1955 | 34.0 | 1985–1990 | 52.1 |
| 1955–1960 | 34.6 | 1990–1995 | 56.4 |
| 1960–1965 | 36.2 | 1995–2000 | 60.5 |
| 1965–1970 | 39.1 | 2000–2005 | 64.0 |
| 1970–1975 | 42.0 | 2005–2010 | 66.7 |
| 1975–1980 | 44.9 | 2010–2015 | 68.9 |
| 1980–1985 | 48.3 |
Source: UN World Population Prospects
Nepal's Health Survey Findings
The Nepal Demographic and Health Survey (NDHS) collects important information about health and population.
Birth Rates and Family Size
This table shows the birth rate (CBR) and the average number of children per woman (TFR) over time. It also shows the difference between cities (Urban) and rural areas.
| Year | Total | Urban | Rural | |||
|---|---|---|---|---|---|---|
| CBR | TFR | CBR | TFR | CBR | TFR | |
| 1996 | 37 | 4.64 (2.9) | 27 | 2.85 (1.9) | 38 | 4.83 (3.1) |
| 2001 | 33.5 | 4.1 (2.5) | 20.6 | 2.1 (1.4) | 34.9 | 4.4 (2.6) |
| 2006 | 28.4 | 3.1 (2.0) | 21.9 | 2.1 (1.4) | 29.5 | 3.3 (2.1) |
| 2011 | 24.3 | 2.6 (1.8) | 16.6 | 1.6 (1.2) | 25.5 | 2.8 (1.8) |
| 2016 | 22.4 | 2.3 (1.7) | 19.9 | 2.0 (1.5) | 26.3 | 2.9 (2.1) |
| 2022 | 20.0 | 2.1 (1.7) | 19.3 | 2.0 (1.6) | 21.4 | 2.4 (1.8) |
The NDHS also found other interesting facts:
- The average time between births for mothers is about 36.2 months. In cities, it's longer (40.3 months) than in rural areas (35.9 months).
- The average age for a woman to have her first child is 20.1 years old.
The number of children women have has been decreasing:
- In 1996, women had about 4.6 children on average.
- By 2011, this number dropped to 2.6 children per woman.
- In cities, women had fewer children (1.6) than in rural areas (2.8).
People in Nepal generally think an ideal family has about 2.1 to 2.3 children. This number is slightly lower in cities than in rural areas.
This table shows what people thought was the ideal family size in 2011, based on their age:
| Age | Women | Men |
|---|---|---|
| 15–19 | 1.9 | 2.2 |
| 20–24 | 1.9 | 2.1 |
| 25–29 | 2.1 | 2.1 |
| 30–34 | 2.2 | 2.3 |
| 35–39 | 2.3 | 2.4 |
| 40–44 | 2.5 | 2.4 |
| 45–49 | 2.6 | 2.6 |
Languages Spoken in Nepal
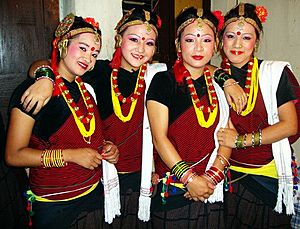
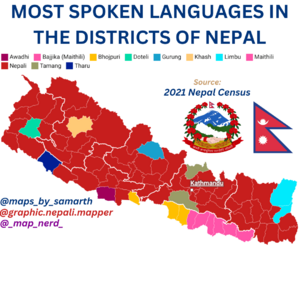
Nepal has many different languages. They come from three main groups: Indo-Aryan, Tibeto-Burman, and some unique local languages. In 2001, 92 different languages were spoken in Nepal.
Nepali is the official language. It comes from the Khas language and is written in the Devanagari script. It became the main language for everyone in Nepal in the late 1700s.
Other major languages include:
- Maithili, Bhojpuri, Bajjika, and Awadhi are spoken in the southern Terai region.
- Nepal Bhasa is spoken by the Newar people, especially in and around Kathmandu Valley.
- In the hills and mountains, you'll find languages like Magar, Gurung, Tamang, and Limbu.
- In the high Himalayas, Tibetan languages like Bhotia are spoken.
More and more people in Nepal are learning English. Many schools, especially in cities, teach in English. Higher education in subjects like science and engineering is also taught in English.
For a long time, the Nepali government promoted Nepali as the main language. This put some local languages at risk of disappearing. But since 1990, the government has been working to protect these languages. They are now recording threatened languages to include more in future censuses.
Religions in Nepal
Religion in Nepal (2021 census) Hinduism (81.19%) Buddhism (8.21%) Islam (5.09%) Kirat Mundhum (3.17%) Christianity (1.76%) Other (0.9%)
In 2021, most people in Nepal (81.19%) were Hindu. About 8.21% were Buddhist, and 5.09% were Muslim. Other religions like Kirat Mundhum and Christianity are also followed.
Nepal is a secular nation, meaning the government does not favor any one religion. It's common for Hindus in Nepal to also worship Buddhist gods. Religion is a very important part of life in Nepal. People often build their social connections through religious celebrations.
In the Kathmandu Valley, where the Newar people live, many homes have small shrines for their gods. The city of Bhaktapur, once a Hindu kingdom, is in this valley. Shrines to Hindu goddesses are found around the valley to protect the city. Hindu and Buddhist shrines often exist side-by-side.
The Hindu god Vishnu is seen as a symbol of moral order. The god Shiva represents the challenges and disorder in the world. Vishnu helps to bring back order when Shiva's actions cause chaos. In recent times, people in Nepal have looked to religion for peace because of political problems and poverty.
Nepal's laws protect all religions but do not allow people to force others to change their religion. In 2006, Nepal was declared a "secular state." This means the government and religion are separate.
Different Groups of People
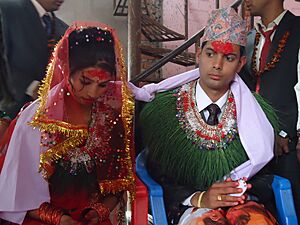
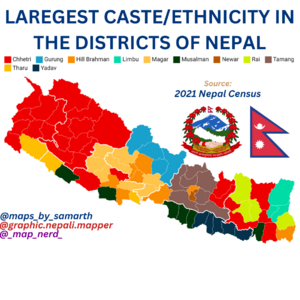
Nepal has many different ethnic groups. Nepali became the national language, and Sanskrit was a required school subject. Children who spoke Nepali had a better chance to pass exams and get good jobs. This put children who spoke local languages at a disadvantage.
This unfairness caused problems and led some groups, like the Madhesi and Tharu, to support rebel groups during the Nepali Civil War. The war ended in 2008, and the King stepped down. Now, the government is working to make things fairer for all ethnic groups.
Even today, people from higher social groups often have more power in Nepal. Newar women, who mostly live in cities, are often more educated and have more opportunities. However, women from other groups, especially in rural areas, may have fewer chances for education and healthcare.
Nepalis Living Abroad
Many Nepali people live in other countries. This is called the Nepali diaspora.
Nepalis in the United Kingdom
In 2001, about 6,000 Nepali people lived in the UK. By 2021, this number grew to 51,000. Many Nepali people are interested in studying in the UK.
Nepalis in Hong Kong
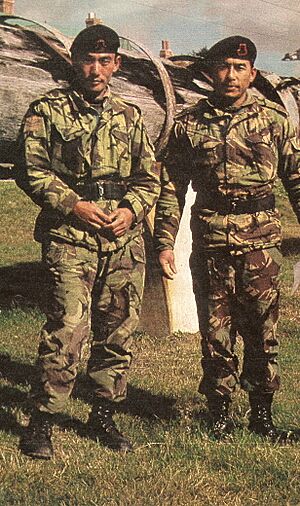
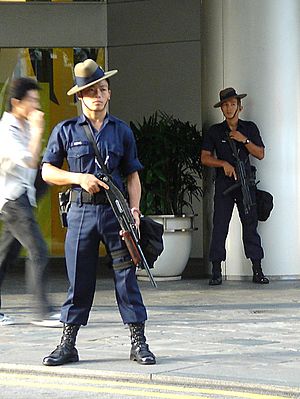
Many Nepali people in Hong Kong are children of former Gurkha soldiers. These soldiers served in the British Army and were based in Hong Kong. After their service, many Gurkhas stayed in Hong Kong.
Older Nepali people in Hong Kong often work in security jobs. Younger generations are more likely to work in business. Most Nepali people in Hong Kong are from the Kirati ethnic groups, like Rai and Limbu.
Nepalis in Other Countries
Nepali migrants working abroad sometimes face difficulties. Since 2000, about 7,500 Nepali people have died in countries like the Middle East and Malaysia.
This table shows where many Nepali people live outside of Nepal:
| Country | Population (thousands) |
|---|---|
| India | 8,000 |
| United Arab Emirates | 400 |
| Saudi Arabia | 297 |
| Australia | 219 |
| United States | 205 |
| Qatar | 200 |
| Japan | 156 |
| United Kingdom | 62 |
| Iraq | 30 |
| South Korea | 22 |
| Hong Kong | 16 |
| Canada | 14 |
| Malaysia | 6 |
| Singapore | 4 |
| China | 3.5 |
| Approx. total | 9,600 |
People from Other Countries in Nepal
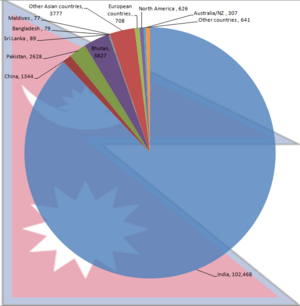
In 2001, about 116,571 people born in other countries were living in Nepal. Most of them (90%) were from India. Others came from Bhutan, Pakistan, and China. This number does not include refugees from Bhutan and Tibet.
See also
- Ethnic groups in Nepal


