Waitetuna River facts for kids
Quick facts for kids Waitetuna River |
|
|---|---|

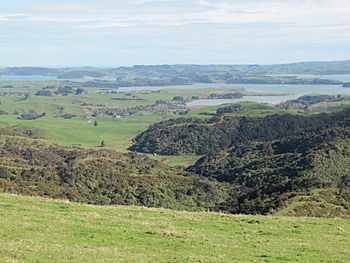
The Waitetuna River flows into the Waitetuna arm of Raglan Harbour.
|
|
| Country | New Zealand |
| Physical characteristics | |
| Main source | 200 m (660 ft) |
| River mouth | Raglan Harbour 0 m (0 ft) |
| Length | 17 km (11 mi) |
| Basin features | |
| Basin size | 167 km2 (64 sq mi) |
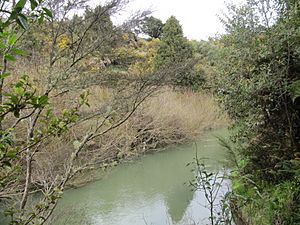
The Waitetuna River is a river in the Waikato Region of New Zealand's North Island. It flows mostly northwest from its start near Whatawhata. The river ends by joining the southeastern part of Raglan Harbour. It is about 17 kilometers (11 miles) long.
Contents
How the River Was Formed
The land around the Waitetuna River was mainly shaped by ancient volcanoes. These volcanoes erupted a long time ago, during the Pliocene and Pleistocene periods. They created rocks like greywacke and layers of ash called tephra.
History of the Waitetuna River
The Waitetuna River has changed a lot over time, especially because of human activity. For thousands of years, the river and harbour collected a small amount of sediment each year. This is natural.
Changes from Deforestation
Around the late 1800s and early 1900s, many forests in the area were cut down. This is called deforestation. When trees are removed, the soil can wash into rivers more easily. This caused a big increase in how much sediment the Waitetuna River carried into Raglan Harbour.
For example, a large area of land near the river's mouth was bought in 1901. A sawmill used the river to float logs across the harbour. This activity likely added to the changes in the river.
Land Sales and Settlement
The river was an important boundary when land was first sold to settlers. In 1851, local Māori chiefs sold a large area of land to Queen Victoria. This land, known as the Whaingaroa Block, included much of the rich farmland between Karioi Mountain and the Waitetuna River. The river helped with transport because it was a natural boundary. Early reports said the soil was very good and there was plenty of timber.
Plants Around the River
Long ago, the flat areas near the river were covered in kahikatea trees. The hills had a mix of podocarp and hardwood forests. These included trees like totara, maire, matai, rimu, rata, beech, and tree ferns. There were also some kauri trees.
Forest to Farmland
Between 1890 and 1930, about 80% of the native forest was cleared. This land was turned into pastures for farming. Later, some pine trees were planted on parts of this former farmland. Today, most of the native forest is only found on the steep slopes of mountains like Karioi and Pirongia.
River Animals and Water Quality
The health of the Waitetuna River's water is important for the animals living there. Scientists measure different things to check water quality.
Water Quality Measures
- E. coli: This is a type of bacteria that can show if there is animal waste in the water. The Waitetuna River sometimes has higher levels of E. coli than recommended for swimming.
- Nitrogen and Phosphorus: These are nutrients that can come from farms and other sources. Too much of them can cause problems for river life.
- Clarity and Turbidity: Clarity means how clear the water is, and turbidity means how cloudy it is. The river's water can sometimes be cloudy.
Overall, the water quality is not always ideal for swimming or for all types of river creatures.
River Life
Despite some challenges, the Waitetuna River is home to various fish and insects.
- Fish: You can find longfin and shortfin eels, common and redfin bully, and different types of galaxiids like inanga.
- Insects: Scientists study small creatures called macroinvertebrates to see how healthy a stream is. Some of the insects found in the Waitetuna and its smaller streams include:
- Spiny-gilled mayflies
- Other types of mayflies
- Caddisflies
- Dobsonflies
- Riffle beetles
- Mud snails
- Sand flies
Some parts of the river, especially smaller streams like Matakotea Stream, provide good homes for native fish.
Pollution in the River
The Waitetuna River has faced challenges with pollution, mainly from farming.
Sources of Pollution
- Farm Runoff: When rain washes over farmland, it can carry animal waste and fertilizers into the river. This adds E. coli and nutrients like nitrogen.
- Fencing: To help reduce pollution, about 6.9% of the riverbanks have fences. These fences stop farm animals from going into the water, which helps keep it cleaner.
Improvements Over Time
Good news! Pollution in the Waitetuna River has been getting better. From 1993 to 2017, the amount of nitrate-nitrogen in the water improved by about 1.3% each year. The water's clarity (how clear it is) also improved by about 3.3% each year from 2008 to 2017. This shows that efforts to reduce pollution are working.
 | Valerie Thomas |
 | Frederick McKinley Jones |
 | George Edward Alcorn Jr. |
 | Thomas Mensah |


