
Wallowa, Oregon facts for kids
Quick facts for kids
Wallowa, Oregon
|
|
|---|---|

Wallowa Public Library
|
|

Location in Oregon
|
|
| Country | United States |
| State | Oregon |
| County | Wallowa |
| Incorporated | 1899 |
| Area | |
| • Total | 0.61 sq mi (1.58 km2) |
| • Land | 0.61 sq mi (1.58 km2) |
| • Water | 0.00 sq mi (0.00 km2) |
| Elevation | 2,936 ft (895 m) |
| Population
(2020)
|
|
| • Total | 796 |
| • Density | 1,302.78/sq mi (503.05/km2) |
| Time zone | UTC-8 (Pacific) |
| • Summer (DST) | UTC-7 (Pacific) |
| ZIP code |
97885
|
| Area code(s) | 541 |
| FIPS code | 41-78150 |
| GNIS feature ID | 2412172 |
Wallowa is a city located in Wallowa County, Oregon, in the United States. In 2010, the city had a population of 808 people. By 2020, the population was 796.
Contents
History of Wallowa
The beautiful Wallowa Valley has long been the home of the Nez Perce people. In the late 1800s, the Wallowa band was one of many groups of the Nez Perce tribe living across the Northwest.
The U.S. government tried to make them leave their land by signing a treaty. When the Nez Perce refused, the army was sent to force them out. Chief Joseph bravely led his people over 1,000 miles, fighting battles with the army as they tried to escape.
The city of Wallowa was officially planned in 1889. The name Wallowa comes from a Nez Perce word. It describes a special triangular structure made of stakes. These stakes held up a network of sticks called lacallas, which were used as fish traps. The Nez Perce tribe used these traps in the Wallowa River, near where Wallowa Lake flows out.
Lewis A. McArthur, who wrote a book called Oregon Geographic Names, believed this explanation for the name. He said that Levi Ankeny, who was very familiar with the early history of the Wallowa Valley and knew many Nez Perce people, provided this information.
Geography and Climate
Wallowa is a small city. The United States Census Bureau says it covers about 0.61 square miles (1.58 square kilometers) of land. There is no water area within the city limits.
Wallowa's Climate
Wallowa has warm, dry summers. The average monthly temperatures do not get extremely hot, staying below 71.6°F (22°C). This type of weather is called a dry-summer humid continental climate. On August 23, 1939, Wallowa recorded its hottest temperature ever, which was 110°F (43°C). The coldest temperature recorded was -38°F (-39°C) on December 13, 1919.
| Climate data for Wallowa, Oregon, 1991–2020 normals, extremes 1903–present | |||||||||||||
|---|---|---|---|---|---|---|---|---|---|---|---|---|---|
| Month | Jan | Feb | Mar | Apr | May | Jun | Jul | Aug | Sep | Oct | Nov | Dec | Year |
| Record high °F (°C) | 64 (18) |
67 (19) |
79 (26) |
90 (32) |
98 (37) |
109 (43) |
108 (42) |
110 (43) |
103 (39) |
92 (33) |
74 (23) |
67 (19) |
110 (43) |
| Mean maximum °F (°C) | 49.9 (9.9) |
56.6 (13.7) |
68.5 (20.3) |
78.0 (25.6) |
86.5 (30.3) |
93.8 (34.3) |
100.4 (38.0) |
99.4 (37.4) |
95.1 (35.1) |
81.6 (27.6) |
63.3 (17.4) |
52.5 (11.4) |
100.9 (38.3) |
| Mean daily maximum °F (°C) | 35.9 (2.2) |
43.0 (6.1) |
52.4 (11.3) |
59.9 (15.5) |
69.3 (20.7) |
76.5 (24.7) |
87.7 (30.9) |
87.7 (30.9) |
78.9 (26.1) |
62.8 (17.1) |
45.8 (7.7) |
35.7 (2.1) |
61.3 (16.3) |
| Daily mean °F (°C) | 28.0 (−2.2) |
32.6 (0.3) |
39.8 (4.3) |
45.7 (7.6) |
53.7 (12.1) |
59.9 (15.5) |
67.2 (19.6) |
66.4 (19.1) |
58.7 (14.8) |
47.0 (8.3) |
35.5 (1.9) |
27.5 (−2.5) |
46.8 (8.2) |
| Mean daily minimum °F (°C) | 20.1 (−6.6) |
22.2 (−5.4) |
27.3 (−2.6) |
31.6 (−0.2) |
38.0 (3.3) |
43.3 (6.3) |
46.7 (8.2) |
45.2 (7.3) |
38.4 (3.6) |
31.1 (−0.5) |
25.1 (−3.8) |
19.3 (−7.1) |
32.4 (0.2) |
| Mean minimum °F (°C) | −1.9 (−18.8) |
3.8 (−15.7) |
14.4 (−9.8) |
20.0 (−6.7) |
25.1 (−3.8) |
32.2 (0.1) |
36.6 (2.6) |
35.0 (1.7) |
27.1 (−2.7) |
16.9 (−8.4) |
8.5 (−13.1) |
0.4 (−17.6) |
−7.5 (−21.9) |
| Record low °F (°C) | −34 (−37) |
−33 (−36) |
−14 (−26) |
5 (−15) |
16 (−9) |
26 (−3) |
22 (−6) |
22 (−6) |
16 (−9) |
5 (−15) |
−22 (−30) |
−38 (−39) |
−38 (−39) |
| Average precipitation inches (mm) | 1.75 (44) |
1.61 (41) |
1.59 (40) |
1.64 (42) |
2.16 (55) |
1.59 (40) |
0.51 (13) |
0.78 (20) |
0.74 (19) |
1.52 (39) |
1.95 (50) |
2.14 (54) |
17.98 (457) |
| Average snowfall inches (cm) | 12.4 (31) |
10.4 (26) |
3.2 (8.1) |
1.0 (2.5) |
0.1 (0.25) |
0.0 (0.0) |
0.0 (0.0) |
0.0 (0.0) |
0.0 (0.0) |
0.2 (0.51) |
5.8 (15) |
14.8 (38) |
47.9 (121.36) |
| Average precipitation days (≥ 0.01 in) | 12.8 | 11.2 | 12.8 | 11.3 | 11.8 | 8.9 | 3.6 | 4.6 | 5.3 | 10.5 | 14.6 | 14.2 | 121.6 |
| Average snowy days (≥ 0.1 in) | 7.2 | 4.6 | 2.8 | 0.9 | 0.2 | 0.0 | 0.0 | 0.0 | 0.0 | 0.3 | 3.8 | 8.2 | 28.0 |
| Source 1: NOAA | |||||||||||||
| Source 2: National Weather Service | |||||||||||||
Population of Wallowa
| Historical population | |||
|---|---|---|---|
| Census | Pop. | %± | |
| 1900 | 243 | — | |
| 1910 | 793 | 226.3% | |
| 1920 | 894 | 12.7% | |
| 1930 | 749 | −16.2% | |
| 1940 | 838 | 11.9% | |
| 1950 | 1,055 | 25.9% | |
| 1960 | 989 | −6.3% | |
| 1970 | 811 | −18.0% | |
| 1980 | 847 | 4.4% | |
| 1990 | 748 | −11.7% | |
| 2000 | 869 | 16.2% | |
| 2010 | 808 | −7.0% | |
| 2020 | 796 | −1.5% | |
| U.S. Decennial Census | |||
2010 Census Details
In 2010, Wallowa had 808 people living in 352 households. About 222 of these were families. The city had about 1325 people per square mile (512 people per square kilometer). There were 394 housing units in total.
Most of the people in Wallowa were White (95.9%). A small number were African American (0.5%), Native American (0.4%), or from other backgrounds. About 2.8% of the population identified as being from two or more races. About 2.0% of the people were of Hispanic or Latino origin.
Of the 352 households, about 25% had children under 18 living there. Half of the households (50%) were married couples. About 9.7% had a female head of household without a husband. About 3.4% had a male head of household without a wife. Nearly 37% of households were not families.
About 31.8% of all households had only one person living there. About 16.5% of households had someone aged 65 or older living alone. The average household had 2.24 people, and the average family had 2.82 people.
The average age in Wallowa was 48.2 years. About 20.7% of residents were under 18. About 21% were 65 years or older. The city had slightly more females (50.7%) than males (49.3%).
Annual Cultural Events
Tamkaliks Celebration
The Tamkaliks Celebration is a special powwow. Its name comes from a Nez Perce word that means "where you can see the mountains." This event started in 1991. It welcomes the Nez Perce people back to the Wallowa Valley, celebrating their history and connection to the land.
Notable People from Wallowa
- Amos Marsh
- Frank Wayne Marsh
- Pearl Alice Marsh
- Ronald Gladden
Schools in Wallowa
Wallowa School District #12 serves the students in Wallowa, Oregon. The district has about 195 students and 35 staff members. Both the elementary and high schools are on the same campus. The district's goal is for all students to become successful and positive members of society.
Wallowa Elementary School
Wallowa Elementary School teaches students from preschool through sixth grade. It has about 100 students. About 62% of the students come from families with lower incomes. About 11% of the students have a disability. The school also has a student-run newspaper called the Cougar Club Chronicle, which is created by the fifth-grade class.
Wallowa Jr./Sr. High School
Wallowa High School teaches students from seventh through twelfth grade. Since 2012, every student has graduated from the high school. The high school used to teach all students from kindergarten to twelfth grade. However, as the number of students grew, a separate elementary school was built.
The school's mascot is the cougar, and its colors are orange and black. The choir program started again in 2015 and did very well at the state competition that same year. Many students also participate in the FFA (Future Farmers of America) program.
Gallery
-
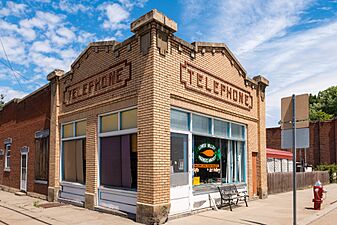
Old telephone building in downtown Wallowa
-
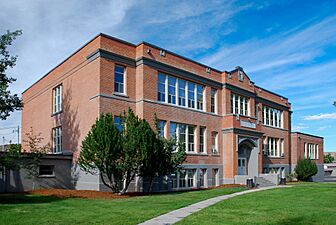
Wallowa High School
-
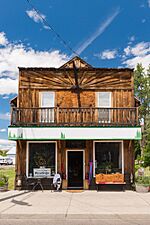
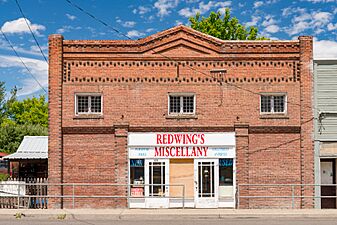
Storefront in Wallowa
-
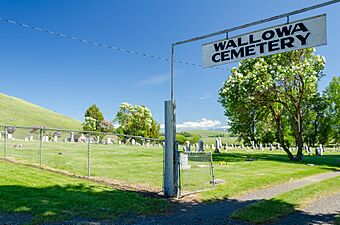
Wallowa Cemetery, one mile east of Wallowa
-
Old building in downtown Wallowa
-
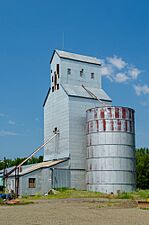
Grain elevator in Wallowa


See also
 In Spanish: Wallowa para niños
