
Waterville, Washington facts for kids
Quick facts for kids
Waterville
|
|
|---|---|
| Waterville, Washington | |

Downtown Waterville pictured in 2018
|
|

Location of Waterville, Washington
|
|
| Country | United States |
| State | Washington |
| County | Douglas |
| Area | |
| • Total | 0.86 sq mi (2.24 km2) |
| • Land | 0.86 sq mi (2.24 km2) |
| • Water | 0.00 sq mi (0.00 km2) |
| Elevation | 2,625 ft (800 m) |
| Population
(2020)
|
|
| • Total | 1,134 |
| • Density | 1,318.60/sq mi (506.25/km2) |
| Time zone | UTC-8 (Pacific (PST)) |
| • Summer (DST) | UTC-7 (PDT) |
| ZIP code |
98858
|
| Area code | 509 |
| FIPS code | 53-76510 |
| GNIS feature ID | 1527848 |
| Website | Town of Waterville |
Waterville is a small town in Washington, United States. It is the main town, or county seat, of Douglas County. Waterville is well-known for its large wheat farms.
This town is part of the Wenatchee-East Wenatchee metropolitan area. In 2020, about 1,134 people lived in Waterville.
Contents
Town History: How Waterville Got Its Name
The area where Waterville now stands was first settled in 1883. A person named A.T. Greene was the first to live there. In 1886, he asked people to donate land. This helped to create the town, which was first called "Jumper's Flat."
Later, a big underground water source was found on Greene's farm. Because of this important discovery, the town was renamed "Waterville."
Geography: Location and Climate

Waterville is located at coordinates 47°38′52″N 120°4′22″W / 47.64778°N 120.07278°W. The town covers an area of about 0.87 square miles (2.24 square kilometers). All of this area is land.
Climate in Waterville
Waterville has a semi-arid climate. This means it has cold, wet winters and hot, dry summers. This type of weather is common in most of Eastern Washington.
High Elevation of Waterville
Waterville is located at 2,625 feet (800 meters) above sea level. This makes it the highest town or city in Washington state.
| Climate data for Waterville, Washington | |||||||||||||
|---|---|---|---|---|---|---|---|---|---|---|---|---|---|
| Month | Jan | Feb | Mar | Apr | May | Jun | Jul | Aug | Sep | Oct | Nov | Dec | Year |
| Record high °F (°C) | 66 (19) |
59 (15) |
74 (23) |
88 (31) |
96 (36) |
102 (39) |
105 (41) |
104 (40) |
97 (36) |
84 (29) |
68 (20) |
56 (13) |
105 (41) |
| Mean daily maximum °F (°C) | 30.3 (−0.9) |
36.1 (2.3) |
45.7 (7.6) |
57.1 (13.9) |
66.2 (19.0) |
73.5 (23.1) |
82.7 (28.2) |
81.6 (27.6) |
72.0 (22.2) |
58.3 (14.6) |
41.1 (5.1) |
31.9 (−0.1) |
56.4 (13.6) |
| Mean daily minimum °F (°C) | 14.8 (−9.6) |
18.9 (−7.3) |
26.7 (−2.9) |
34.1 (1.2) |
41.0 (5.0) |
47.0 (8.3) |
52.5 (11.4) |
52.3 (11.3) |
44.6 (7.0) |
34.9 (1.6) |
25.1 (−3.8) |
17.6 (−8.0) |
34.1 (1.2) |
| Record low °F (°C) | −30 (−34) |
−25 (−32) |
−10 (−23) |
11 (−12) |
16 (−9) |
29 (−2) |
32 (0) |
29 (−2) |
15 (−9) |
4 (−16) |
−21 (−29) |
−33 (−36) |
−33 (−36) |
| Average precipitation inches (mm) | 1.44 (37) |
1.10 (28) |
0.82 (21) |
0.69 (18) |
0.96 (24) |
0.93 (24) |
0.39 (9.9) |
0.49 (12) |
0.53 (13) |
0.75 (19) |
1.49 (38) |
1.69 (43) |
11.28 (286.9) |
| Average snowfall inches (cm) | 11.4 (29) |
8.2 (21) |
3.4 (8.6) |
0.7 (1.8) |
trace | 0.0 (0.0) |
0.0 (0.0) |
0.0 (0.0) |
trace | 0.4 (1.0) |
6.6 (17) |
14.0 (36) |
44.9 (114) |
Population: Who Lives in Waterville
| Historical population | |||
|---|---|---|---|
| Census | Pop. | %± | |
| 1890 | 293 | — | |
| 1900 | 482 | 64.5% | |
| 1910 | 950 | 97.1% | |
| 1920 | 1,198 | 26.1% | |
| 1930 | 856 | −28.5% | |
| 1940 | 939 | 9.7% | |
| 1950 | 1,013 | 7.9% | |
| 1960 | 1,013 | 0.0% | |
| 1970 | 919 | −9.3% | |
| 1980 | 908 | −1.2% | |
| 1990 | 995 | 9.6% | |
| 2000 | 1,163 | 16.9% | |
| 2010 | 1,138 | −2.1% | |
| 2020 | 1,134 | −0.4% | |

In 2010, the town of Waterville had 1,138 people living there. These people lived in 449 households. About 316 of these were families.
Diversity in Waterville
Most of the people in Waterville (94.5%) were White. About 1.1% were Native American, and 0.6% were Asian. People from other backgrounds made up smaller parts of the population. About 9.8% of the people were of Hispanic or Latino origin.
Households and Families
About 30.3% of households had children under 18 living with them. More than half (57.5%) were married couples. Some households had a single parent, either a mother (9.6%) or a father (3.3%). About 23.8% of households were single people living alone. Many of these were people aged 65 or older.
The average household had about 2.51 people. The average family had about 2.98 people.
Age of Residents
The average age of people in Waterville was 43.3 years old.
- About 22.8% of residents were under 18.
- About 7.4% were between 18 and 24.
- About 21.5% were between 25 and 44.
- About 30.5% were between 45 and 64.
- About 17.9% were 65 years old or older.
The town had a nearly equal number of males and females. About 50.4% were male and 49.6% were female.
Education: Schools in Waterville
The Waterville School District is in charge of the public school in town.
Images for kids
-
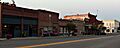
Downtown Waterville pictured in 2018
-
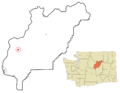
Location of Waterville, Washington
-
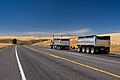
Truck in front of a wheat field near Waterville
-
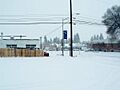
Waterville during a snow storm.
See also
 In Spanish: Waterville (Washington) para niños
