
Wollondilly Shire facts for kids
Quick facts for kids Wollondilly ShireNew South Wales |
|||||||||||||||
|---|---|---|---|---|---|---|---|---|---|---|---|---|---|---|---|

Location in Outer Metropolitan Sydney
|
|||||||||||||||
| Established | 7 March 1906 | ||||||||||||||
| Area | 2,560 km2 (988.4 sq mi) | ||||||||||||||
| Mayor | Matt Gould | ||||||||||||||
| Council seat | Picton | ||||||||||||||
| Region | Macarthur Blue Mountains Central Tablelands Greater Western Sydney |
||||||||||||||
| State electorate(s) | Wollondilly | ||||||||||||||
| Federal Division(s) | |||||||||||||||
| Website | Wollondilly Shire | ||||||||||||||
|
|||||||||||||||
Wollondilly Shire is a special area in New South Wales, Australia. It's located on the southwestern edge of the bigger Sydney area. This means it's a mix of city and country life. You'll find it where the Macarthur, Blue Mountains, and Central Tablelands regions meet.
Wollondilly Shire is like a bridge between the busy Sydney area and the quieter parts of regional NSW. It was officially created on March 7, 1906. Later, in 1940, it joined up with the town of Picton. The Shire gets its name from the Wollondilly River.
You can travel through the area using the Hume Highway or the Southern Highlands railway line. Wollondilly Shire has many small towns and villages. These are surrounded by farms and amazing sandstone gorges. To the west, there's a lot of wild nature. This includes the Nattai Wilderness and the Burragorang Valley.
Most of the Shire is either a national park or part of Sydney's water supply system. In fact, Wollondilly Shire provides 97% of all the water for Sydney! The current Mayor of Wollondilly Shire is Cr. Matt Gould. He is an independent politician.
Contents
How the Council Started
Wollondilly Shire was officially formed on March 7, 1906. This happened after a new law called the Local Government (Shires) Act 1905 was passed. The new Shire covered a large area. It was next to places like Camden, Campbelltown, Picton, and Nepean Shire.
A temporary group of five members was chosen on May 16, 1906. They helped set up the new council. These first members included Richard Henry Antill and George Macarthur-Onslow. The group had its first meeting on June 15, 1906. They chose George Macarthur-Onslow as their Chairman.
The first elections for the council happened on November 24, 1906. Six councillors were chosen from three different areas. George Macarthur-Onslow became the first Shire President. However, he resigned soon after. John E. Moore then took over as Shire President.
Over the years, some parts of the Shire changed. In 1911, a piece of the Blue Mountains Shire joined Wollondilly. Later, in 1940, a part of Wollondilly Shire moved to Nepean Shire.
Joining with Picton
When Wollondilly Shire first started in 1906, the town of Picton was a separate area. Picton had its own local council since 1895.
In 1939, people in Picton voted on whether to join Wollondilly Shire. More people voted yes than no. So, on May 1, 1940, Picton officially became part of Wollondilly Shire. After this, the Shire Council grew to have eight councillors. The main office for the council also moved from The Oaks to Picton.
Who Lives in Wollondilly Shire?
Let's look at the people who call Wollondilly Shire home. In 2016, about 48,519 people lived here. There were about the same number of males and females. About 2.4% of the people were Aboriginal and Torres Strait Islander people.
The average age of people in Wollondilly Shire was 36 years old. About 23.1% of the population were children aged 0–14 years. Around 10.8% were people aged 65 years and older. Most adults, about 54.9%, were married.
The number of people living in Wollondilly Shire has been growing. Between 2001 and 2006, the population grew by 9.18%. From 2006 to 2011, it grew by 7.23%.
Most people in Wollondilly Shire have Australian or Anglo-Saxon backgrounds. This is similar to the national average. Many people, over 69%, said they belonged to a Christian religion. This is higher than the national average.
Most households in Wollondilly Shire speak only English at home. About 91.2% of homes speak only English. This is much higher than the national average.
How the Council Works Today
The Wollondilly Shire Council has nine councillors. They are chosen by the people in two different areas, called wards. Each ward elects four councillors. There is also a mayor who is chosen by all the voters in the Shire. All councillors serve for four years.
Currently, all nine councillors are Independents. This means they don't belong to a major political party.
The current council was elected in December 2021. Matt Gould became the first mayor to be chosen directly by the people. Before this, the councillors themselves would pick the mayor. The Mayor and councillors also have special jobs, called portfolios. These jobs mean they look after specific areas like roads or the environment.
Here are some of the current council members and their special jobs:
- Mayor Matt Gould: Looks after Agriculture and Indigenous Matters.
- Deputy Mayor Matthew Deeth: Focuses on Customer Experience and Corporate Services.
- Councillor Paul Rogers: Handles Roads.
- Councillor Michael Banasik: Works on Environment, Mining, and Energy.
- Councillor Suzy Brandstater: Manages Arts & Culture, Sustainable Growth & Planning.
- Councillor Hilton Gibbs: Deals with Traffic Management & Transport, and Community Facilities.
- Councillor Blair Briggs: Oversees Emergency Management, Economic Development, Sport & Wellbeing.
- Councillor Judy Hannan: Focuses on Tourism and Heritage.
- Councillor Beverley Spearpoint: Works on Community matters.
Important Places in Wollondilly Shire
Wollondilly Shire has many places that are important for their history. These are called heritage-listed sites. They include:
- Cataract Dam on Cataract Road in Appin.
- Windmill Hill, Appin on Wilton Road in Appin.
- Nepean Dam on Avon Dam Road in Bargo.
- Wirrimbirra Sanctuary on Hume Highway in Bargo.
- Bargo railway viaduct near the railway in Bargo.
- Camden Park Estate on Elizabeth Macarthur Avenue in Camden Park.
- Cordeaux Dam on the Cordeaux River in Cordeaux.
- Couridjah railway station on the railway in Couridjah.
- Menangle railway station on the railway in Menangle.
- Nepean River railway bridge, Menangle on the railway in Menangle.
- Brownlow Hill Estate on Brownlow Hill Loop Road in Orangeville.
- Jarvisfield on Hume Highway Deviation in Picton.
- Picton railway station on the railway in Picton.
- Stonequarry Creek railway viaduct, Picton on the railway in Picton.
- Abbotsford on Oaks Road in Picton.
- Victoria Bridge, Picton on Prince Street in Picton.
- Tahmoor railway station on the railway in Tahmoor.
- Rail Paybus FP1 at the NSW Rail Transport Museum in Thirlmere.
- Coxs River track on Coxs River Arms in Warragamba.
- Megarritys Bridge at Warragamba Dam.
- Warragamba Dam - Haviland Park at Warragamba Dam.
- Warragamba Dam Emergency Scheme at Warragamba Dam.
- Wilton Park on Wilton Park Road in Wilton.
Local News and Media
Wollondilly is served by a few local news sources. You can read two local newspapers: the District Reporter and the Wollondilly Express. There are also regional radio stations like 2MCR and C91.3FM. The "Macarthur Chronicle" is another regional newspaper that covers the wider Macarthur area.
Images for kids
-
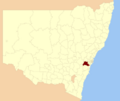
Location in Outer Metropolitan Sydney
-

Wollondilly Shire Council Logo
