Åsele Municipality facts for kids
Quick facts for kids
Åsele Municipality
Åsele kommun
|
||
|---|---|---|
 |
||
|
||
 |
||
| Country | Sweden | |
| County | Västerbotten County | |
| Seat | Åsele | |
| Area | ||
| • Total | 4,574.11 km2 (1,766.07 sq mi) | |
| • Land | 4,276.95 km2 (1,651.34 sq mi) | |
| • Water | 297.16 km2 (114.73 sq mi) | |
| Area as of January 1, 2010. | ||
| Population
(June 30, 2012)
|
||
| • Total | 3,085 | |
| • Density | 0.67445/km2 (1.74681/sq mi) | |
| Time zone | UTC+1 (CET) | |
| • Summer (DST) | UTC+2 (CEST) | |
| ISO 3166 code | SE | |
| Province | Lapland | |
| Municipal code | 2463 | |
| Website | www.asele.se | |
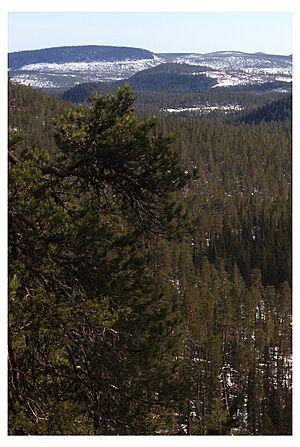
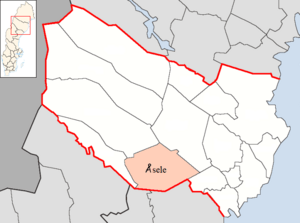
Åsele Municipality (called Åsele kommun in Swedish) is a local government area in northern Sweden. It is part of Västerbotten County. The main town and administrative center is Åsele. This municipality is located at the southern edge of Lapland, a large region in northern Sweden.
Contents
History of Åsele Municipality
The area of Åsele Municipality was first home to the native Sami people. The first Swedish settlers arrived in Gafsele in 1674. Nils Andersson and his wife Brita came from Finland. They were trying to avoid a war with Russia.
Naming of Fredrika
Fredrika is a parish, or church district, within the municipality. It was created in 1799. The parish was named after Queen Frederica Dorothea Wilhelmina of Sweden. Other nearby parishes were also named after queens, like Dorotea and Vilhelmina. However, Åsele decided to keep its original name. The people of Åsele were proud of their town and its history.
Changes in Municipal Borders
In 1974, the former market town of Åsele joined with Dorotea and Fredrika. This created a larger municipality. But in 1980, the Dorotea part separated. It then formed its own new municipality called Dorotea Municipality.
Geography and Nature
The Ångerman River flows through Åsele Municipality. It starts in Vilhelmina and continues through Åsele. Many electric power stations have been built along this river. These stations use the river's flow to create electricity.
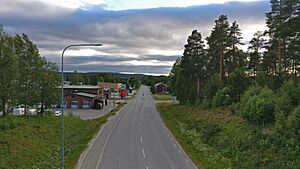
The main town, Åsele, is located in the middle of the municipality. It has a church made of wood. There is also a small open-air museum that shows the area's history. For those who enjoy sports, there is a nine-hole golf course.
Main Localities
Åsele Municipality has two main urban areas, also known as localities:
| # | Locality | Population |
|---|---|---|
| 1 | Åsele | 1,920 |
| 2 | Fredrika | 254 |
The main town is shown in bold
Population and Voting
Åsele Municipality has a total of 2,803 residents. Of these, 2,126 are Swedish citizens old enough to vote. Citizens vote in elections to choose their representatives in the Riksdag, which is Sweden's parliament.
Other Interesting Facts
Åsele Municipality has recently gained attention for a special reason. It is planned to be the future home of Europe's largest Thai Buddhist temple. This will be an important cultural and religious site.
See also
 In Spanish: Åsele para niños
 | Aurelia Browder |
 | Nannie Helen Burroughs |
 | Michelle Alexander |


