Emporia, Virginia facts for kids
Quick facts for kids
Emporia, Virginia
|
||
|---|---|---|

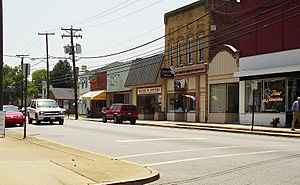
Downtown Emporia
|
||
|
||
| Nickname(s):
"E-Town"
|
||

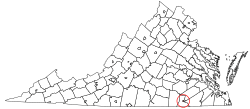
Location in the Commonwealth of Virginia
|
||
| Country | United States | |
| State | Virginia | |
| County | Greensville (None after incorporation -Independent city) | |
| Chartered | 1967 | |
| Area | ||
| • Total | 6.97 sq mi (18.05 km2) | |
| • Land | 6.90 sq mi (17.88 km2) | |
| • Water | 0.06 sq mi (0.17 km2) | |
| Elevation | 128 ft (39 m) | |
| Population
(2020)
|
||
| • Total | 5,766 | |
| • Density | 827.3/sq mi (319.45/km2) | |
| Time zone | UTC-5 (EST) | |
| • Summer (DST) | UTC-4 (EDT) | |
| ZIP code |
23847/23867
|
|
| Area code(s) | 434 | |
| FIPS code | 51-25808 | |
| GNIS feature ID | 1498475 | |
Emporia is an independent city in Virginia, USA. It is surrounded by Greensville County. Emporia has been the main town, or county seat, of Greensville County since 1791. In 2020, about 5,766 people lived there. This makes it one of the smaller cities in Virginia.
Contents
History of Emporia
Emporia has always been an important place for travel. The Meherrin River flows through the area. Long ago, it was a major pathway for Native American people.
Early Settlements
The town of Hicksford was started by Captain Robert Hicks. He was an Indian trader in the Virginia Colony. Hicksford was where a main road crossed the Meherrin River. This road led to Fort Christanna. In 1709, Captain Hicks bought a large piece of land along the river.
When Greensville County was formed in 1781, Hicksford became its county seat. This meant it was the center for the county's government. In 1781, British soldiers even crossed the river at Hicksford during a raid.
Later, another town called Belfield was recognized in 1798. It was on the north side of the river. Hicksford was on the south side. Hicksford grew more than Belfield over the years.
Railroads and Growth
During the American Civil War, railroads were very important. The Petersburg Railroad, built in 1830, ran through Belfield. It was a key route for supplies. Battles were fought nearby to control this railroad.
In 1887, Hicksford and Belfield joined together. They formed a new town called Emporia. It was named after Emporia, Kansas. This was the hometown of a friend of Benjamin D. Tillar Jr., who helped create the Atlantic and Danville Railway. Other railroads also passed through Emporia.
Emporia continued to grow. In 1900, the town started to issue bonds. This helped pay for a water plant, lighting, and street improvements. New brick buildings replaced older wooden ones. Banks and other businesses also opened.
In 1967, Emporia became an independent city. Today, major railway lines cross in Emporia. Important roads like U.S. Route 58 and Interstate 95 also pass through. Emporia is still a place where many travelers stop.
Historic Places
Emporia has several historic buildings. These include the Belfield-Emporia Historic District and the Hicksford-Emporia Historic District. Other notable places are the Greensville County Courthouse Complex and the Greensville County Training School. These sites are listed on the National Register of Historic Places.
Geography and Location
Emporia is located at 36°41′34″N 77°32′17″W / 36.69278°N 77.53806°W.
The city covers about 7 square miles (18 square kilometers). Most of this area is land. Only a small part is water. Emporia is about 65 miles south of Richmond. It is also about 80 miles west of Norfolk.
Climate
Emporia has a climate with warm summers and mild winters.
| Climate data for Emporia, Virginia (1991–2020 normals, extremes 1893–present) | |||||||||||||
|---|---|---|---|---|---|---|---|---|---|---|---|---|---|
| Month | Jan | Feb | Mar | Apr | May | Jun | Jul | Aug | Sep | Oct | Nov | Dec | Year |
| Record high °F (°C) | 81 (27) |
82 (28) |
89 (32) |
95 (35) |
98 (37) |
106 (41) |
109 (43) |
103 (39) |
100 (38) |
100 (38) |
85 (29) |
80 (27) |
109 (43) |
| Mean daily maximum °F (°C) | 50.9 (10.5) |
54.2 (12.3) |
61.5 (16.4) |
71.7 (22.1) |
78.8 (26.0) |
86.0 (30.0) |
89.8 (32.1) |
88.3 (31.3) |
82.7 (28.2) |
72.9 (22.7) |
62.6 (17.0) |
54.0 (12.2) |
71.1 (21.7) |
| Daily mean °F (°C) | 39.8 (4.3) |
42.4 (5.8) |
49.0 (9.4) |
58.7 (14.8) |
67.2 (19.6) |
75.4 (24.1) |
79.6 (26.4) |
78.1 (25.6) |
72.2 (22.3) |
60.9 (16.1) |
50.4 (10.2) |
43.1 (6.2) |
59.7 (15.4) |
| Mean daily minimum °F (°C) | 28.7 (−1.8) |
30.5 (−0.8) |
36.6 (2.6) |
45.8 (7.7) |
55.7 (13.2) |
64.8 (18.2) |
69.3 (20.7) |
67.8 (19.9) |
61.6 (16.4) |
49.0 (9.4) |
38.3 (3.5) |
32.3 (0.2) |
48.4 (9.1) |
| Record low °F (°C) | −24 (−31) |
0 (−18) |
12 (−11) |
21 (−6) |
32 (0) |
41 (5) |
50 (10) |
43 (6) |
34 (1) |
23 (−5) |
12 (−11) |
0 (−18) |
−24 (−31) |
| Average precipitation inches (mm) | 3.40 (86) |
2.59 (66) |
4.05 (103) |
3.43 (87) |
3.71 (94) |
3.97 (101) |
4.86 (123) |
5.07 (129) |
4.92 (125) |
3.47 (88) |
3.16 (80) |
3.56 (90) |
46.19 (1,173) |
| Average snowfall inches (cm) | 0.6 (1.5) |
0.3 (0.76) |
0.0 (0.0) |
0.0 (0.0) |
0.0 (0.0) |
0.0 (0.0) |
0.0 (0.0) |
0.0 (0.0) |
0.0 (0.0) |
0.0 (0.0) |
0.0 (0.0) |
0.5 (1.3) |
1.4 (3.6) |
| Average precipitation days (≥ 0.01 in) | 10.0 | 8.7 | 10.3 | 9.2 | 10.5 | 9.5 | 10.6 | 9.2 | 8.9 | 7.0 | 8.3 | 9.9 | 112.1 |
| Average snowy days (≥ 0.1 in) | 0.3 | 0.2 | 0.0 | 0.0 | 0.0 | 0.0 | 0.0 | 0.0 | 0.0 | 0.0 | 0.0 | 0.2 | 0.7 |
| Source: NOAA | |||||||||||||
City Government
| Year | Republican | Democratic | Third party | |||
|---|---|---|---|---|---|---|
| No. | % | No. | % | No. | % | |
| 2024 | 744 | 34.14% | 1,419 | 65.12% | 16 | 0.73% |
| 2020 | 754 | 31.67% | 1,612 | 67.70% | 15 | 0.63% |
| 2016 | 789 | 33.35% | 1,530 | 64.67% | 47 | 1.99% |
| 2012 | 886 | 32.86% | 1,793 | 66.51% | 17 | 0.63% |
| 2008 | 897 | 34.28% | 1,702 | 65.04% | 18 | 0.69% |
| 2004 | 970 | 43.67% | 1,247 | 56.15% | 4 | 0.18% |
| 2000 | 938 | 45.10% | 1,116 | 53.65% | 26 | 1.25% |
| 1996 | 835 | 40.65% | 1,103 | 53.70% | 116 | 5.65% |
| 1992 | 1,094 | 47.18% | 1,048 | 45.19% | 177 | 7.63% |
| 1988 | 1,289 | 56.61% | 977 | 42.91% | 11 | 0.48% |
| 1984 | 1,252 | 60.25% | 807 | 38.84% | 19 | 0.91% |
| 1980 | 988 | 51.95% | 855 | 44.95% | 59 | 3.10% |
| 1976 | 1,055 | 52.23% | 899 | 44.50% | 66 | 3.27% |
| 1972 | 1,340 | 68.82% | 565 | 29.02% | 42 | 2.16% |
| 1968 | 812 | 37.06% | 657 | 29.99% | 722 | 32.95% |
Emporia is run by a council/manager system. This means there is a city council and a city manager. The city council has seven members. They are elected from different areas of the city. There is also a Mayor who is elected by all the people in the city.
Both the city council members and the mayor serve for four years. Their terms are set up so that not everyone is elected at the same time. This helps keep the government running smoothly.
Emporia also has its own Treasurer, Commissioner of the Revenue, Sheriff, and General Registrar. Some services are shared with Greensville County. These include the court system, the Sheriff's office, and the public schools.
Population and People
| Historical population | |||
|---|---|---|---|
| Census | Pop. | %± | |
| 1890 | 1,088 | — | |
| 1900 | 1,027 | −5.6% | |
| 1910 | 2,018 | 96.5% | |
| 1920 | 1,869 | −7.4% | |
| 1930 | 2,144 | 14.7% | |
| 1940 | 2,735 | 27.6% | |
| 1950 | 5,664 | 107.1% | |
| 1960 | 5,535 | −2.3% | |
| 1970 | 5,300 | −4.2% | |
| 1980 | 4,840 | −8.7% | |
| 1990 | 5,306 | 9.6% | |
| 2000 | 5,665 | 6.8% | |
| 2010 | 5,927 | 4.6% | |
| 2020 | 5,766 | −2.7% | |
| U.S. Decennial Census 1790-1960 1900-1990 1990-2000 |
|||
2020 Census Information
| Race / Ethnicity (NH = Non-Hispanic) | Pop. 2010 | Pop. 2020 | % 2010 | % 2020 |
|---|---|---|---|---|
| White alone (NH) | 1,848 | 1,529 | 31.18% | 26.52% |
| Black or African American alone (NH) | 3,685 | 3,631 | 62.17% | 62.97% |
| Native American or Alaska Native alone (NH) | 8 | 7 | 0.13% | 0.12% |
| Asian alone (NH) | 43 | 50 | 0.73% | 0.87% |
| Pacific Islander alone (NH) | 4 | 4 | 0.07% | 0.07% |
| Other race alone (NH) | 7 | 37 | 0.12% | 0.64% |
| Mixed race or Multiracial (NH) | 70 | 163 | 1.18% | 2.83% |
| Hispanic or Latino (any race) | 262 | 345 | 4.42% | 5.98% |
| Total | 5,927 | 5,766 | 100.00% | 100.00% |
In 2020, the population of Emporia was 5,766 people. Most residents were Black or African American (about 63%). White people made up about 26.5% of the population. Other groups included Asian, Native American, and Pacific Islander people. About 6% of the population was Hispanic or Latino.
2010 Census Information
In 2010, there were 5,927 people living in Emporia. About 62.5% were Black or African American. About 32.7% were White. Other groups included Asian, Native American, and Pacific Islander people. About 4.4% of the population was Hispanic or Latino.
Fun Festivals
Emporia hosts some fun events!
- The Emporia Bicycling Club holds regular group rides. One popular event is the annual Great Peanut Ride. Hundreds of bicyclists come to visit a peanut farm. They enjoy tasty meals and live entertainment.
- The Virginia Pork Festival used to be held every June. It served over 40,000 pounds of pork! This festival is currently not happening due to a lack of money.
Education
Greensville County Public Schools serves students in both Emporia and Greensville County. The high school for the area is Greensville County High School.
Around 1972, some people in Emporia wanted to create their own separate school system. However, the United States Supreme Court did not allow this.
Notable People from Emporia
Many interesting people have come from Emporia, Virginia. Here are a few:
- John N. Dalton, a former Governor of Virginia
- Willie Gillus, a former NFL football player
- Benjamin S. Griffin, a retired U.S. Army General
- Henry Jordan, an NFL player in the Pro Football Hall of Fame
- Sharon Manning, a professional basketball player and coach
- John Y. Mason, who served as U.S. Secretary of the Navy
- Elliott Sadler, a NASCAR racecar driver
- Hermie Sadler, also a NASCAR racecar driver
- Bryant Stith, a basketball player for the University of Virginia and the NBA
See also
 In Spanish: Emporia para niños


