
2006 Canadian federal election facts for kids
|
|||||||||||||||||||||||||||||||||||||||||||||||||||||||||||||||||||||||||||||
|
|
|||||||||||||||||||||||||||||||||||||||||||||||||||||||||||||||||||||||||||||
|
308 seats in the House of Commons 155 seats needed for a majority |
|||||||||||||||||||||||||||||||||||||||||||||||||||||||||||||||||||||||||||||
|---|---|---|---|---|---|---|---|---|---|---|---|---|---|---|---|---|---|---|---|---|---|---|---|---|---|---|---|---|---|---|---|---|---|---|---|---|---|---|---|---|---|---|---|---|---|---|---|---|---|---|---|---|---|---|---|---|---|---|---|---|---|---|---|---|---|---|---|---|---|---|---|---|---|---|---|---|---|
| Opinion polls | |||||||||||||||||||||||||||||||||||||||||||||||||||||||||||||||||||||||||||||
| Turnout | 64.7% ( |
||||||||||||||||||||||||||||||||||||||||||||||||||||||||||||||||||||||||||||
|
|||||||||||||||||||||||||||||||||||||||||||||||||||||||||||||||||||||||||||||

Popular vote by province, with graphs indicating the number of seats won. As this is an FPTP election, seat totals are not determined by popular vote by province but instead via results by each riding.
|
|||||||||||||||||||||||||||||||||||||||||||||||||||||||||||||||||||||||||||||
|
|||||||||||||||||||||||||||||||||||||||||||||||||||||||||||||||||||||||||||||


.jpg)
.jpg)
The 2006 Canadian federal election was an important event in Canada. It happened on January 23, 2006. During this election, Canadians voted for people to represent them in the House of Commons of Canada. These elected people then form the 39th Parliament of Canada.
In Canada, a federal election is how citizens choose their government. People vote for a candidate in their local area, called a riding. The party that wins the most seats usually forms the government.

Contents
What Were the Results of the Election?
The 2006 election saw a change in which party led Canada. The Conservative Party won the most seats. This meant they could form a new government.
How Many Seats Did Each Party Win?
The House of Commons has 308 seats. To form a majority government, a party needs to win at least 155 seats. In this election, no single party won a majority. This is called a minority government.
Here's how many seats the main parties won:
- Conservative Party: 124 seats
- Liberal Party: 103 seats
- Bloc Québécois: 51 seats
- New Democrats: 29 seats
- Independent: 1 seat

After the election, Stephen Harper, the leader of the Conservative Party, became the new Prime Minister. He took over from Paul Martin of the Liberal Party.
What Was the Popular Vote?
The popular vote shows the total number of votes each party received across the country. It's different from the number of seats won.
Here's the percentage of the popular vote for the main parties:
- Conservative Party: 36.27%
- Liberal Party: 30.23%
- New Democrats: 17.48%
- Bloc Québécois: 10.48%
- Green Party: 4.48%
| Party | Party leader | Candi- dates |
Seats | Popular vote | ||||||||
|---|---|---|---|---|---|---|---|---|---|---|---|---|
| 2004 | Dissol. | 2006 | % Change | # | % | Change | ||||||
| Conservative | Stephen Harper | 308 | 99 | 98 | 124 | +26.3% | 5,374,071 | 36.27% | +6.64pp | |||
| Liberal | Paul Martin | 308 | 135 | 133 | 103 | -23.7% | 4,479,415 | 30.23% | -6.50pp | |||
| Bloc Québécois | Gilles Duceppe | 75 | 54 | 53 | 51 | -5.6% | 1,553,201 | 10.48% | -1.90pp | |||
| New Democrats | Jack Layton | 308 | 19 | 18 | 29 | +52.6% | 2,589,597 | 17.48% | +1.71pp | |||
| Independents and no affiliation | 90 | 1 | 4 | 11 | - | 81,860 | 0.55% | -0.07pp | ||||
| Green | Jim Harris | 308 | - | - | - | 664,068 | 4.48% | +0.19pp | ||||
| Christian Heritage | Ron Gray | 45 | - | - | - | 28,152 | 0.19% | -0.11pp | ||||
| Progressive Canadian | Tracy Parsons | 25 | - | - | - | 14,151 | 0.10% | +0.02pp | ||||
| Marijuana | Blair Longley | 23 | - | - | - | 9,171 | 0.06% | -0.18pp | ||||
| Marxist-Leninist | Sandra L. Smith | 69 | - | - | - | 8,980 | 0.06% | +0.00pp | ||||
| Canadian Action | Connie Fogal | 34 | - | - | - | 6,102 | 0.04% | -0.02pp | ||||
| Communist | Miguel Figueroa | 21 | - | - | - | 3,022 | 0.02% | -0.01pp | ||||
| Libertarian | Jean-Serge Brisson | 10 | - | - | - | 3,002 | 0.02% | +0.01pp | ||||
| First Peoples National | Barbara Wardlaw | 5 | * | - | - | * | 1,201 | 0.0081% | * | |||
| Western Block | Doug Christie | 4 | * | - | - | * | 1,094 | 0.0074% | * | |||
| Animal Alliance | Liz White | 1 | * | - | - | * | 72 | 0.00049% | * | |||
| Vacant | 2 | |||||||||||
| Total | 1634 | 308 | 308 | 308 | ±0.0% | 14,817,159 | 100% | |||||
| Source: Elections Canada | ||||||||||||
Notes:
- Official candidate nominations closed January 2, 2006. Candidate totals cited above are based on official filings: http://www.elections.ca/content.asp?section=ele&document=index&dir=39ge/can&lang=e&textonly=false. Nominations were official on January 5, 2006.
- "% change" refers to change from previous election
- * indicates the party did not contest in the previous election.
- 1 André Arthur was elected as an independent candidate in the Quebec City-area riding of Portneuf—Jacques-Cartier. He personally won 20,158 votes.
How Did Provinces Vote?
Voting results can look different in each province and territory. Some parties are stronger in certain parts of Canada.

- The Conservative Party did very well in Alberta and Saskatchewan.
- The Liberal Party won many seats in Ontario and the Atlantic provinces.
- The Bloc Québécois mostly won seats in Quebec.
- The New Democrats gained more support in British Columbia and Ontario.
One interesting event happened after the election. David Emerson, who was elected as a Liberal in British Columbia, decided to join the Conservative Party. This happened before the new Parliament officially started.
Also, André Arthur was elected as an independent candidate. This means he did not belong to any major political party. He won his seat in Quebec.
Images for kids
-

Election signs for the Conservatives, Liberals and NDP in the snow in Ottawa South, showing Canada's mid-winter election.
-
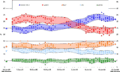
This chart shows how much support each party had during the election campaign. You can see how the support for the Liberals and Conservatives changed over time.

See also
 In Spanish: Elecciones federales de Canadá de 2006 para niños
