Canyondam, California facts for kids
Quick facts for kids
Canyondam
|
|
|---|---|

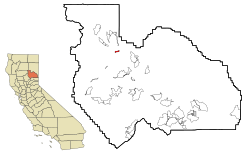
Location in Plumas County and the state of California
|
|
| Country | |
| State | |
| County | Plumas |
| Area | |
| • Total | 0.77 sq mi (1.99 km2) |
| • Land | 0.77 sq mi (1.99 km2) |
| • Water | 0.00 sq mi (0.00 km2) 0% |
| Elevation | 4,593 ft (1,400 m) |
| Population
(2020)
|
|
| • Total | 30 |
| • Density | 39.11/sq mi (15.11/km2) |
| Time zone | UTC-8 (Pacific (PST)) |
| • Summer (DST) | UTC-7 (PDT) |
| ZIP code |
95923
|
| Area code(s) | 530 |
| FIPS code | 06-10914 |
| GNIS feature IDs | 1658212; 2407959 |
Canyondam is a small community in Plumas County, United States. It's located close to the dam that creates Lake Almanor. In 2010, the population was 31 people. Sadly, on August 6, 2021, a large wildfire called the Dixie Fire destroyed most of the community.
Contents
History of Canyondam
Canyondam had a post office that first opened in 1940. It closed for a few years in 1944 but then reopened in 1952.
On May 23, 2013, a strong earthquake with a magnitude of 5.7 hit the area. Its center was only about 1.6 miles (2.6 km) from Canyondam. People felt the shaking across much of Northern California.
The Dixie Fire Disaster
On August 6, 2021, the huge Dixie Fire swept through Canyondam. The fire was so powerful that it burned almost all the buildings. About 95% of the structures in the town were destroyed, including the post office.
Where is Canyondam?
Canyondam is located in California, specifically in Plumas County. It covers a total area of about 0.8 square miles (1.99 square kilometers). All of this area is land, with no water.
Canyondam's Weather
Canyondam has a type of weather called a Mediterranean climate. This means it has warm, dry summers. The average monthly temperatures during summer don't go above 71.6°F (22°C). Winters are generally mild, but it can get very cold with snow.
| Climate data for Canyondam (1914-2012) | |||||||||||||
|---|---|---|---|---|---|---|---|---|---|---|---|---|---|
| Month | Jan | Feb | Mar | Apr | May | Jun | Jul | Aug | Sep | Oct | Nov | Dec | Year |
| Record high °F (°C) | 67 (19) |
72 (22) |
84 (29) |
87 (31) |
95 (35) |
102 (39) |
104 (40) |
104 (40) |
98 (37) |
95 (35) |
74 (23) |
68 (20) |
104 (40) |
| Mean daily maximum °F (°C) | 40.6 (4.8) |
44.9 (7.2) |
49.9 (9.9) |
57.3 (14.1) |
67.6 (19.8) |
77.4 (25.2) |
85.5 (29.7) |
85.2 (29.6) |
78.0 (25.6) |
64.6 (18.1) |
49.2 (9.6) |
39.9 (4.4) |
61.7 (16.5) |
| Mean daily minimum °F (°C) | 23.3 (−4.8) |
25.2 (−3.8) |
27.4 (−2.6) |
31.5 (−0.3) |
37.7 (3.2) |
43.7 (6.5) |
48.8 (9.3) |
48.0 (8.9) |
41.8 (5.4) |
35.3 (1.8) |
28.3 (−2.1) |
23.3 (−4.8) |
34.5 (1.4) |
| Record low °F (°C) | −16 (−27) |
−14 (−26) |
−5 (−21) |
6 (−14) |
19 (−7) |
26 (−3) |
31 (−1) |
25 (−4) |
22 (−6) |
13 (−11) |
4 (−16) |
−14 (−26) |
−16 (−27) |
| Average precipitation inches (mm) | 6.65 (169) |
6.54 (166) |
5.04 (128) |
2.65 (67) |
1.62 (41) |
0.76 (19) |
0.18 (4.6) |
0.25 (6.4) |
0.65 (17) |
2.16 (55) |
4.38 (111) |
6.23 (158) |
37.11 (943) |
| Average snowfall inches (cm) | 29.8 (76) |
24.5 (62) |
20.3 (52) |
6.1 (15) |
0.7 (1.8) |
0.1 (0.25) |
0 (0) |
0 (0) |
0 (0) |
1.0 (2.5) |
8.0 (20) |
24.0 (61) |
114.5 (290.55) |
| Average extreme snow depth inches (cm) | 26 (66) |
28 (71) |
22 (56) |
7 (18) |
0 (0) |
0 (0) |
0 (0) |
0 (0) |
0 (0) |
0 (0) |
5 (13) |
16 (41) |
34 (86) |
| Average precipitation days | 11.5 | 11 | 11 | 8.5 | 7 | 3.5 | 1 | 1 | 2 | 5.5 | 8.5 | 11.5 | 82 |
| Average snowy days | 6.5 | 6 | 5 | 2.5 | 0.5 | 0 | 0 | 0 | 0 | 0.4 | 2.5 | 5.5 | 28.9 |
| Source: WRCC | |||||||||||||
Who Lives in Canyondam?
| Historical population | |||
|---|---|---|---|
| Census | Pop. | %± | |
| 2020 | 30 | — | |
| U.S. Decennial Census 1850–1870 1880-1890 1900 1910 1920 1930 1940 1950 1960 1970 1980 1990 2000 2010 |
|||
Population in 2010
In 2010, Canyondam had a population of 31 people. Most of the residents (about 84%) were White. There were also some Native American and Asian residents. About 6.5% of the people were of Hispanic or Latino background.
There were 17 households in total. Some had children, and some were single people living alone. The average household had about 1.8 people. The median age of residents was 48.5 years old. This means half the people were younger than 48.5, and half were older.
Most people (58%) owned their homes, while others rented.
Population in 2000
In the year 2000, Canyondam had 37 people living there. The population density was about 48 people per square mile (18.5 people per square kilometer). Most residents (89%) were White, and about 11% were Native American.
There were 21 households. Some had children, and many were single people. The average household size was 1.76 people. The median age was 50 years old.
See also
 In Spanish: Canyondam para niños
 | Janet Taylor Pickett |
 | Synthia Saint James |
 | Howardena Pindell |
 | Faith Ringgold |


