
Chile Chico facts for kids
Quick facts for kids
Chile Chico
|
|||||
|---|---|---|---|---|---|
|
Town and Commune
|
|||||
 |
|||||
|
|||||
| Country | |||||
| Region | Aisén | ||||
| Province | General Carrera | ||||
| Government | |||||
| • Type | Municipality | ||||
| Area | |||||
| • Total | 5,922.3 km2 (2,286.6 sq mi) | ||||
| Elevation | 214 m (702 ft) | ||||
| Population
(2012 Census)
|
|||||
| • Total | 4,627 | ||||
| • Density | 0.78128/km2 (2.02352/sq mi) | ||||
| • Urban | 3,042 | ||||
| • Rural | 1,402 | ||||
| Sex | |||||
| • Men | 2,378 | ||||
| • Women | 2,066 | ||||
| Time zone | UTC-4 (CLT) | ||||
| • Summer (DST) | UTC-3 (CLST) | ||||
| Area code(s) | 56 + 67 | ||||
| Climate | Csb | ||||
| Website | Municipality of Chile Chico | ||||


Chile Chico means Little Chile in Spanish. It is a town in the General Carrera Province of the Aisén Region in Patagonia, Chile. You can find it on the south shore of General Carrera Lake.
About 3,000 people live in Chile Chico. It is the main town of its local area, called a commune. It is also the capital of the General Carrera Province.
The town is only 6 kilometers (about 4 miles) west of the border with Argentina. It is also 8 kilometers (about 5 miles) from the Argentine town of Los Antiguos. A paved road connects these two towns. You can also take a car ferry across the lake to Puerto Ingeniero Ibáñez.
Since 2017, Chile Chico has been home to the world's southernmost wine production. This special wine is made at an experimental vineyard. It is part of the Instituto de Investigación Agropecuaria.
Contents
What is the Climate Like in Chile Chico?
Chile Chico has a special Mediterranean climate. This is because it is in a "rain shadow" area. This means mountains block most of the rain. It is much drier than other places nearby. For example, it gets only half the rain of Balmaceda. It gets less than a tenth of the rain that coastal areas in Aisén get.
The weather here is often compared to Middle Chile. It is also similar to places like Sequim in the USA. These places also have a rain shadow effect. The highest temperature ever recorded was 36.4°C (97.5°F) in January 2013. The lowest was -13.8°C (7.2°F) in July 1982.
| Climate data for Chile Chico (1970–2000, extremes 1952–present) | |||||||||||||
|---|---|---|---|---|---|---|---|---|---|---|---|---|---|
| Month | Jan | Feb | Mar | Apr | May | Jun | Jul | Aug | Sep | Oct | Nov | Dec | Year |
| Record high °C (°F) | 36.4 (97.5) |
34.0 (93.2) |
31.6 (88.9) |
28.5 (83.3) |
23.4 (74.1) |
19.4 (66.9) |
18.7 (65.7) |
19.9 (67.8) |
23.4 (74.1) |
26.4 (79.5) |
30.7 (87.3) |
33.2 (91.8) |
36.4 (97.5) |
| Mean daily maximum °C (°F) | 21.6 (70.9) |
21.7 (71.1) |
19.0 (66.2) |
14.8 (58.6) |
10.3 (50.5) |
7.4 (45.3) |
7.0 (44.6) |
9.2 (48.6) |
12.3 (54.1) |
15.6 (60.1) |
18.5 (65.3) |
20.5 (68.9) |
14.8 (58.6) |
| Daily mean °C (°F) | 17.9 (64.2) |
17.7 (63.9) |
15.2 (59.4) |
11.4 (52.5) |
7.1 (44.8) |
4.1 (39.4) |
3.9 (39.0) |
5.9 (42.6) |
9.1 (48.4) |
12.4 (54.3) |
15.0 (59.0) |
17.0 (62.6) |
11.3 (52.3) |
| Mean daily minimum °C (°F) | 11.8 (53.2) |
10.7 (51.3) |
8.5 (47.3) |
5.6 (42.1) |
2.6 (36.7) |
0.2 (32.4) |
−0.3 (31.5) |
1.0 (33.8) |
3.7 (38.7) |
6.4 (43.5) |
9.2 (48.6) |
11.2 (52.2) |
5.9 (42.6) |
| Record low °C (°F) | −1.9 (28.6) |
−1.6 (29.1) |
−4.8 (23.4) |
−6.5 (20.3) |
−9.0 (15.8) |
−11.4 (11.5) |
−13.8 (7.2) |
−12.6 (9.3) |
−7.4 (18.7) |
−6.2 (20.8) |
−4.0 (24.8) |
−3.2 (26.2) |
−13.8 (7.2) |
| Average precipitation mm (inches) | 12.1 (0.48) |
9.7 (0.38) |
17.6 (0.69) |
23.9 (0.94) |
45.4 (1.79) |
41.2 (1.62) |
51.9 (2.04) |
36.6 (1.44) |
23.2 (0.91) |
14.1 (0.56) |
9.9 (0.39) |
10.1 (0.40) |
295.7 (11.64) |
| Average precipitation days | 3 | 3 | 4 | 6 | 9 | 9 | 9 | 8 | 5 | 4 | 3 | 3 | 66 |
| Average relative humidity (%) | 45 | 45 | 50 | 56 | 67 | 71 | 69 | 62 | 54 | 47 | 44 | 44 | 55 |
| Source: Dirección Meteorológica de Chile: Climatología | |||||||||||||
Who Lives in Chile Chico?
In 2002, a count of the population was done. This is called a census. It showed that Chile Chico had 4,444 people living there. Out of these, 2,378 were men and 2,066 were women.
Most people, about 3,042 (68.5%), lived in the town itself. The rest, 1,402 people (31.5%), lived in the countryside nearby. Between 1992 and 2002, the population grew by 18.3%. This means 687 more people came to live in Chile Chico.
How is Chile Chico Governed?
Chile Chico is a "commune". This is a local area that manages itself. It is run by a municipal council. This council is led by an alcalde. An alcalde is like a mayor. The alcalde is chosen by the people in an election every four years.
From 2008 to 2012, the alcalde was Luperciano Muñoz González. He belonged to the PPD political party.
Images for kids
-
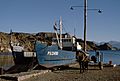
Chile Chico seen from a ship and with a horse

See also
 In Spanish: Chile Chico para niños
