Coal Creek, Jefferson County, Colorado facts for kids
Quick facts for kids
Coal Creek, Colorado
|
|
|---|---|

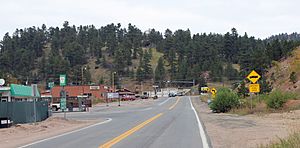
"Downtown" Coal Creek Canyon.
|
|

|
|
| Country | |
| State | |
| Counties | Jefferson County Boulder County, Gilpin County |
| Government | |
| • Type | unincorporated community |
| Area | |
| • Total | 24.355 km2 (9.404 sq mi) |
| • Land | 24.316 km2 (9.388 sq mi) |
| • Water | 0.039 km2 (0.015 sq mi) |
| Elevation | 2,668 m (8,754 ft) |
| Population
(2020)
|
|
| • Total | 2,494 |
| • Density | 102.402/km2 (265.22/sq mi) |
| Time zone | UTC-7 (MST) |
| • Summer (DST) | UTC-6 (MDT) |
| ZIP Code |
Golden 80403
|
| Area codes | 303 & 720 |
| GNIS feature ID | 2407642 |
Coal Creek, also known as Coal Creek Canyon, is a special kind of community in Colorado, United States. It's called a census-designated place (CDP). This means it's an area that the government counts for population, but it's not an officially incorporated city or town.
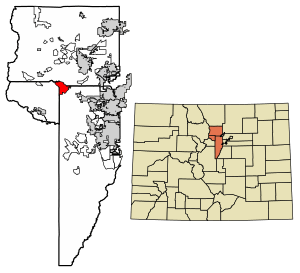
Coal Creek is unique because it's located across three different counties: Jefferson County, Boulder County, and Gilpin County. Most of it is in Jefferson County. In 2020, about 2,494 people lived here. The local mail for Coal Creek comes from the Golden post office.
Contents
Where is Coal Creek Located?
Coal Creek is a fairly large area. It covers about 24.355 square kilometers (which is about 9.4 square miles). Most of this area is land, with only a tiny bit of water.
What's the Weather Like?
Coal Creek has a climate that gets warm in the summer. It's often described as a warm-summer humid continental climate. This means it has warm summers and cold, snowy winters. It's also very close to what's called an oceanic climate, which usually has milder temperatures.
Temperature and Precipitation
The weather in Coal Creek can change a lot throughout the year. Summers are generally warm, with average high temperatures in July around 73°F (23°C). Winters are cold, with average high temperatures in January around 33°F (1°C).
It gets a good amount of rain and snow. April and May are usually the wettest months for rain. When it comes to snow, March and April see the most, with over 35 inches (89 cm) each month!
| Climate data for Coal Creek Canyon, Colorado, 1991–2020 normals, extremes 1984–2019 | |||||||||||||
|---|---|---|---|---|---|---|---|---|---|---|---|---|---|
| Month | Jan | Feb | Mar | Apr | May | Jun | Jul | Aug | Sep | Oct | Nov | Dec | Year |
| Record high °F (°C) | 60 (16) |
58 (14) |
66 (19) |
73 (23) |
81 (27) |
88 (31) |
89 (32) |
87 (31) |
84 (29) |
75 (24) |
67 (19) |
60 (16) |
89 (32) |
| Mean maximum °F (°C) | 51.5 (10.8) |
51.4 (10.8) |
58.3 (14.6) |
63.9 (17.7) |
71.7 (22.1) |
80.5 (26.9) |
83.2 (28.4) |
81.0 (27.2) |
76.9 (24.9) |
68.7 (20.4) |
58.3 (14.6) |
51.6 (10.9) |
84.4 (29.1) |
| Mean daily maximum °F (°C) | 33.4 (0.8) |
34.2 (1.2) |
41.2 (5.1) |
45.9 (7.7) |
55.3 (12.9) |
66.7 (19.3) |
73.0 (22.8) |
71.2 (21.8) |
64.3 (17.9) |
51.8 (11.0) |
40.9 (4.9) |
33.2 (0.7) |
50.9 (10.5) |
| Daily mean °F (°C) | 24.5 (−4.2) |
24.4 (−4.2) |
30.7 (−0.7) |
35.2 (1.8) |
44.0 (6.7) |
54.0 (12.2) |
60.3 (15.7) |
58.6 (14.8) |
51.7 (10.9) |
40.8 (4.9) |
31.0 (−0.6) |
24.0 (−4.4) |
39.9 (4.4) |
| Mean daily minimum °F (°C) | 15.6 (−9.1) |
14.7 (−9.6) |
20.2 (−6.6) |
24.4 (−4.2) |
32.6 (0.3) |
41.2 (5.1) |
47.5 (8.6) |
46.1 (7.8) |
39.2 (4.0) |
29.8 (−1.2) |
21.1 (−6.1) |
14.8 (−9.6) |
28.9 (−1.7) |
| Mean minimum °F (°C) | −6.8 (−21.6) |
−8.4 (−22.4) |
−0.4 (−18.0) |
7.5 (−13.6) |
19.3 (−7.1) |
31.1 (−0.5) |
39.1 (3.9) |
36.7 (2.6) |
24.8 (−4.0) |
12.4 (−10.9) |
0.9 (−17.3) |
−8.3 (−22.4) |
−15.5 (−26.4) |
| Record low °F (°C) | −24 (−31) |
−36 (−38) |
−18 (−28) |
−10 (−23) |
4 (−16) |
26 (−3) |
33 (1) |
30 (−1) |
3 (−16) |
−11 (−24) |
−17 (−27) |
−30 (−34) |
−36 (−38) |
| Average precipitation inches (mm) | 1.00 (25) |
1.32 (34) |
2.68 (68) |
3.79 (96) |
3.24 (82) |
2.19 (56) |
2.89 (73) |
2.84 (72) |
1.86 (47) |
1.66 (42) |
1.23 (31) |
1.13 (29) |
25.83 (655) |
| Average snowfall inches (cm) | 17.4 (44) |
23.2 (59) |
35.6 (90) |
42.0 (107) |
16.6 (42) |
0.9 (2.3) |
0.0 (0.0) |
0.0 (0.0) |
2.7 (6.9) |
16.1 (41) |
18.4 (47) |
21.8 (55) |
194.7 (494.2) |
| Average precipitation days (≥ 0.01 in) | 9.6 | 10.4 | 11.2 | 13.6 | 13.6 | 12.2 | 14.8 | 15.4 | 9.8 | 8.1 | 8.1 | 9.0 | 135.8 |
| Average snowy days (≥ 0.1 in) | 10.5 | 11.3 | 12.1 | 12.7 | 6.9 | 0.9 | 0.0 | 0.0 | 1.2 | 6.2 | 8.4 | 10.0 | 80.2 |
| Source 1: NOAA | |||||||||||||
| Source 2: National Weather Service (mean maxima and minima 1984–2019) | |||||||||||||
How Many People Live Here?
The United States Census Bureau keeps track of how many people live in places like Coal Creek. They first counted Coal Creek as a CDP for the year 2000.
| Coal Creek CDP, Colorado | ||
|---|---|---|
| Year | Pop. | ±% |
| 2000 | 2,323 | — |
| 2010 | 2,400 | +3.3% |
| 2020 | 2,494 | +3.9% |
| Source: United States Census Bureau | ||
As you can see from the table, the number of people living in Coal Creek has slowly grown over the years. In 2000, there were 2,323 residents. By 2010, it increased to 2,400, and in 2020, it reached 2,494 people.
 | Janet Taylor Pickett |
 | Synthia Saint James |
 | Howardena Pindell |
 | Faith Ringgold |


