
Demographics of Azerbaijan facts for kids
The demographics of Azerbaijan is all about the people living in Azerbaijan. It looks at things like how many people there are, where they live (in cities or the countryside), their age, what languages they speak, their ethnic backgrounds, and their religions. It also studies how the population changes over time, like how many babies are born and how long people live.

Contents
Total Population
The population of Azerbaijan has changed a lot over the years. Here's a look at how the number of people living in cities and rural areas has grown.
| Year | 1897 | 1908 | 1917 | 1920 | 1923 | 1930 | 1940 | 1941 | 1942 | 1943 | 1944 | 1945 | 1946 | 1947 | 1948 | 1949 | 1950 | 1960 | 1970 | 1980 | 1990 | 2000 | 2009 | 2010 | |
|---|---|---|---|---|---|---|---|---|---|---|---|---|---|---|---|---|---|---|---|---|---|---|---|---|---|
| City | 305.1 | - | 560.2 | 405.8 | 486.0 | 750.9 | 1212.0 | 1239.8 | 1195.5 | 1138.1 | 1105.8 | 1118.5 | 1159.9 | 1163.1 | 1110.1 | 1149.1 | 1252.3 | 1835.2 | 2564.6 | 3247.5 | 3847.3 | 4116.4 | 4818.7 | - | |
| Rural | 1501.6 | - | 1793.5 | 1546.4 | 1377.0 | 1818.6 | 2062.0 | 2092.0 | 1961.6 | 1780.0 | 1670.9 | 1587.1 | 1574.6 | 1577.4 | 1589.2 | 1583.5 | 1606.6 | 1980.5 | 2552.5 | 2866.8 | 3284.6 | 3916.4 | 4078.6 | - | |
| Total | 1806.7 | 2014.3 | 2353.7 | 1952.2 | 1863.0 | 2569.5 | 3274.0 | 3331.8 | 3157.1 | 2918.1 | 2776.7 | 2705.6 | 2734.5 | 2740.5 | 2699.3 | 2732.6 | 2858.9 | 3815.7 | 5117.1 | 6114.3 | 7131.9 | 8032.8 | 8896.9 | 9000.0. |
In 2010, the total population of Azerbaijan was about 9,047,000 people.
Vital Statistics
Vital statistics show how many people are born, how many die, and how these numbers change the population. This helps us understand if a population is growing or shrinking.
| Average population (x 1000) | Live births | Deaths | Natural change | Crude birth rate (per 1000) | Crude death rate (per 1000) | Natural change (per 1000) | Total fertility rate | |
|---|---|---|---|---|---|---|---|---|
| 1960 | 3 895 | 165 849 | 25 918 | 139 931 | 42.6 | 6.7 | 35.9 | |
| 1961 | 4 026 | 170 504 | 27 295 | 143 209 | 42.4 | 6.8 | 35.6 | |
| 1962 | 4 163 | 168 341 | 30 901 | 137 440 | 40.4 | 7.4 | 33.0 | |
| 1963 | 4 303 | 175 033 | 30 230 | 144 803 | 40.7 | 7.0 | 33.7 | |
| 1964 | 4 441 | 176 546 | 31 841 | 144 705 | 39.8 | 7.2 | 32.6 | |
| 1965 | 4 575 | 167 429 | 29 095 | 138 334 | 36.6 | 6.4 | 30.2 | |
| 1966 | 4 703 | 166 545 | 31 657 | 134 888 | 35.4 | 6.7 | 28.7 | |
| 1967 | 4 826 | 157 270 | 32 338 | 124 932 | 32.6 | 6.7 | 25.9 | |
| 1968 | 4 945 | 158 962 | 32 950 | 126 012 | 32.1 | 6.7 | 25.4 | |
| 1969 | 5 060 | 148 078 | 35 428 | 112 650 | 29.3 | 7.0 | 22.3 | |
| 1970 | 5 172 | 150 976 | 34 506 | 116 470 | 29.2 | 6.7 | 22.5 | |
| 1971 | 5 281 | 146 261 | 34 236 | 112 025 | 27.7 | 6.5 | 21.2 | |
| 1972 | 5 387 | 137 752 | 35 658 | 102 094 | 25.6 | 6.6 | 19.0 | |
| 1973 | 5 491 | 138 569 | 34 770 | 103 799 | 25.2 | 6.3 | 18.9 | |
| 1974 | 5 591 | 139 084 | 36 082 | 103 002 | 24.9 | 6.5 | 18.4 | |
| 1975 | 5 689 | 141 857 | 39 291 | 102 566 | 24.9 | 6.9 | 18.0 | |
| 1976 | 5 784 | 147 199 | 38 029 | 109 170 | 25.4 | 6.6 | 18.8 | |
| 1977 | 5 878 | 146 822 | 39 035 | 107 787 | 25.0 | 6.6 | 18.4 | |
| 1978 | 5 970 | 148 812 | 39 936 | 108 876 | 24.9 | 6.7 | 18.2 | |
| 1979 | 6 028 | 153 080 | 43 022 | 110 058 | 25.4 | 7.1 | 18.3 | |
| 1980 | 6 161 | 154 974 | 43 064 | 111 910 | 25.2 | 7.0 | 18.2 | |
| 1981 | 6 260 | 164 577 | 42 898 | 121 679 | 26.3 | 6.9 | 19.4 | |
| 1982 | 6 351 | 160 425 | 42 376 | 118 049 | 25.3 | 6.7 | 18.6 | |
| 1983 | 6 453 | 168 644 | 42 944 | 125 700 | 26.1 | 6.7 | 19.5 | |
| 1984 | 6 560 | 174 437 | 44 845 | 129 592 | 26.6 | 6.8 | 19.8 | |
| 1985 | 6 661 | 177 657 | 45 179 | 132 478 | 26.7 | 6.8 | 19.9 | |
| 1986 | 6 760 | 186 609 | 45 344 | 141 265 | 27.6 | 6.7 | 20.9 | |
| 1987 | 6 866 | 184 585 | 45 744 | 138 841 | 26.9 | 6.7 | 20.2 | |
| 1988 | 6 980 | 184 350 | 47 485 | 136 865 | 26.4 | 6.8 | 19.6 | |
| 1989 | 7 085 | 181 631 | 44 016 | 137 615 | 25.6 | 6.2 | 19.4 | |
| 1990 | 7 153 | 182 989 | 42 819 | 140 170 | 25.6 | 6.0 | 19.6 | 2.77 |
| 1991 | 7 271 | 190 353 | 44 659 | 145 694 | 26.2 | 6.1 | 20.0 | |
| 1992 | 7 382 | 181 361 | 51 258 | 130 103 | 24.6 | 6.9 | 17.6 | |
| 1993 | 7 495 | 174 618 | 52 809 | 121 809 | 23.3 | 7.0 | 16.3 | |
| 1994 | 7 597 | 159 761 | 54 921 | 104 840 | 21.0 | 7.2 | 13.8 | |
| 1995 | 7 685 | 143 315 | 50 828 | 92 487 | 18.6 | 6.6 | 12.0 | 2.29 |
| 1996 | 7 763 | 129 247 | 48 242 | 81 005 | 16.6 | 6.2 | 10.4 | 2.10 |
| 1997 | 7 838 | 132 052 | 46 962 | 85 090 | 16.8 | 6.0 | 10.9 | 2.10 |
| 1998 | 7 915 | 123 996 | 46 299 | 77 697 | 15.7 | 5.8 | 9.8 | 2.00 |
| 1999 | 7 985 | 117 539 | 46 295 | 71 244 | 14.7 | 5.8 | 8.9 | 2.00 |
| 2000 | 8 074 | 116 994 | 46 701 | 70 293 | 14.5 | 5.8 | 8.7 | 1.99 |
| 2001 | 8 153 | 110 356 | 45 284 | 65 072 | 13.5 | 5.6 | 8.0 | 1.83 |
| 2002 | 8 230 | 110 715 | 46 522 | 64 193 | 13.4 | 5.6 | 7.8 | 1.84 |
| 2003 | 8 309 | 113 467 | 49 001 | 64 466 | 13.7 | 5.9 | 7.8 | 1.91 |
| 2004 | 8 398 | 131 609 | 49 568 | 82 041 | 15.7 | 5.9 | 9.8 | 2.10 |
| 2005 | 8 500 | 141 901 | 51 962 | 89 939 | 16.7 | 6.1 | 10.6 | 2.33 |
| 2006 | 8 610 | 148 946 | 52 248 | 96 698 | 17.3 | 6.1 | 11.2 | 2.33 |
| 2007 | 8 723 | 151 963 | 53 655 | 98 308 | 17.4 | 6.2 | 11.3 | 2.33 |
| 2008 | 8 839 | 152 086 | 52 710 | 99 376 | 17.2 | 6.0 | 11.3 | 2.25 |
| 2009 | 8 947 | 152 139 | 52 514 | 99 625 | 17.0 | 5.9 | 11.1 | 2.26 |
| 2010 | 9 054 | 165 643 | 53 580 | 112 063 | 18.3 | 5.9 | 12.4 | 2.27 |
| 2011 | 9 173 | 176 072 | 53 762 | 122 310 | 19.2 | 5.9 | 13.3 | 2.38 |
| 2012 | 9 296 | 174 469 | 55 017 | 119 452 | 18.8 | 5.9 | 12.9 |
Ethnic Groups
Azerbaijan is home to many different ethnic groups. The largest group is the Azerbaijanis. Here's a table showing the main ethnic groups and how their numbers have changed over time.
| Ethnic group |
Census 19261 | Census 19392 | Census 19593 | Census 19704 | Census 19795 | Census 19896 | Census 19996 | Census 2009 | ||||||||
|---|---|---|---|---|---|---|---|---|---|---|---|---|---|---|---|---|
| Number | % | Number | % | Number | % | Number | % | Number | % | Number | % | Number | % | Number | % | |
| Azerbaijanis | 1,437,977 | 62.1 | 1,870,471 | 58.4 | 2,494,381 | 67.5 | 3,776,778 | 73.8 | 4,708,832 | 78.1 | 5,804,980 | 82.7 | 7,205,464 | 90.6 | 8,172,800 | 91.6 |
| Lezgins | 37,263 | 1.6 | 111,666 | 3.5 | 98,211 | 2.7 | 137,250 | 2.7 | 158,057 | 2.6 | 171,395 | 2.4 | 178,021 | 2.2 | 180,300 | 2.02 |
| Armenians | 282,004 | 12.2 | 388,025 | 12.1 | 442,089 | 12.0 | 483,520 | 9.4 | 475,486 | 7.9 | 390,505 | 5.6 | 120,7458 | 1.5 | 120,3008 | 1.35 |
| Russians | 220,545 | 9.5 | 528,318 | 16.5 | 501,282 | 13.6 | 510,059 | 10.0 | 475,255 | 7.9 | 392,304 | 5.6 | 141,687 | 1.8 | 119,300 | 1.35 |
| Talysh | 77,323 | 3.3 | 87,510 | 2.7 | 85 | 0.0 | 21,169 | 0.3 | 76,841 | 1.0 | 112,000 | 1.26 | ||||
| Avars | 19,104 | 0.8 | 15,740 | 0.5 | 17,254 | 0.5 | 30,735 | 0.6 | 35,991 | 0.6 | 44,072 | 0.6 | 50,871 | 0.6 | 49,800 | 0.56 |
| Turks | 95 | 0.0 | 600 | 0.0 | 202 | 0.0 | 8,491 | 0.2 | 7,926 | 0.1 | 17,705 | 0.3 | 43,454 | 0.5 | 38,000 | 0,43 |
| Tatars | 9,948 | 0.4 | 27,591 | 0.9 | 29,370 | 0.8 | 31,353 | 0.6 | 31,204 | 0.5 | 28,019 | 0.4 | 30,011 | 0.4 | 25,900 | 0,29 |
| Tat | 28,443 | 1.2 | 2,289 | 0.1 | 5,887 | 0.2 | 7,769 | 0.2 | 8,848 | 0.1 | 10,239 | 0.1 | 10,922 | 0.1 | 25,200 | 0.28 |
| Ukrainians | 18,241 | 0.8 | 23,643 | 0.7 | 25,778 | 0.7 | 29,160 | 0.6 | 26,402 | 0.4 | 32,345 | 0.5 | 28,984 | 0.4 | 21,500 | 0,24 |
| Tsakhurs | 15,552 | 0.7 | 6,464 | 0.2 | 2,876 | 0.1 | 6,208 | 0.1 | 8,546 | 0.1 | 13,318 | 0.2 | 15,877 | 0.2 | 12,300 | 0.14 |
| Udins | 2,445 | 0.1 | 3,202 | 0.1 | 5,492 | 0.1 | 5,841 | 0.1 | 6,125 | 0.1 | 4,152 | 0.1 | 3,800 | 0.04 | ||
| Georgians | 9,500 | 0.4 | 10,196 | 0.3 | 9,526 | 0.3 | 13,595 | 0.3 | 11,412 | 0.2 | 14,197 | 0.2 | 14,877 | 0.2 | 9,900 | 0.11 |
| Jews | 20,578 | 0.9 | 41,245 | 1.3 | 40,198 | 1.1 | 48,652 | 1.0 | 35,487 | 0.6 | 30,792 | 0.4 | 8,916 | 0.1 | 9,100 | 0.1 |
| Kurds | 41,1937 | 1.8 | 6,005 | 0.2 | 1,487 | 0.0 | 5,488 | 0.1 | 5,676 | 0.1 | 12,226 | 0.2 | 13,075 | 0.2 | 6,100 | 0.07 |
| Others | 94,360 | 4.1 | 85,387 | 2.7 | 25,889 | 0.7 | 22,531 | 0.4 | 31,552 | 0.5 | 31,787 | 0.5 | 9,541 | 0.1 | 9,500 | 0.11 |
| Total | 2,314,571 | 3,205,150 | 3,697,717 | 5,117,081 | 6,026,515 | 7,021,178 | 7,953,438 | 8,922,400 | ||||||||
| 1 Source: [1]. 2 Source: [2]. 3 Source: [3]. 4 Source: [4]. 5 Source: [5]. 6 Source: [6]. 7 In 1926, many Kurds lived in the Kurdistan Uyezd area. 8 Many Armenians live in the Nagorno Karabakh region. | ||||||||||||||||
Languages
The official language of Azerbaijan is Azerbaijani, spoken by most of the population. Other languages spoken include Lezgi and Russian.
- Azerbaijani: 92.3%
- Lezgi: 2.2%
- Russian: 1.8%
- Other languages: 3.3%
- No information given: 1% (1999 census)
Demographic Statistics
Here are some interesting facts about the population of Azerbaijan.
Age Structure
- 0-14 years: 22.3% (These are children and young teens.)
- 15-64 years: 71.9% (This is the working-age population.)
- 65 years and over: 5.8% (This is the older population.)
(2012 estimate)
Median Age
The median age is the middle age of the population. Half the people are younger, and half are older.
- Total: 28.2 years
- Male: 26.6 years
- Female: 30 years
(2009 estimate)
Urbanization
Urbanization looks at how many people live in cities compared to rural areas.
- Urban population: 52% of the total population (2008)
- Rate of urbanization: The number of people moving to cities is growing by 1% each year (2005-2010 estimate).
Sex Ratio
The sex ratio compares the number of males to females in the population.
- At birth: About 113 males for every 100 females
- Under 15 years: About 112 males for every 100 females
- 15-64 years: About 96 males for every 100 females
- 65 years and over: About 58 males for every 100 females
- Total population: About 97 males for every 100 females
(2009 estimate)
Infant Mortality Rate
This is the number of babies who die before their first birthday, per 1,000 live births.
- Total: 10.6 deaths per 1,000 live births
Life Expectancy at Birth
This is the average number of years a person is expected to live.
- Total population: 66.66 years
- Male: 62.53 years
- Female: 71.34 years
(2009 estimate)
Total Fertility Rate
This is the average number of children a woman is expected to have in her lifetime.
- 2.04 children born per woman (2009 estimate)
- 1.92 children born per woman (2012 estimate)
Nationality
- Noun: Azerbaijani(s)
- Adjective: Azerbaijani
Religions
Most people in Azerbaijan identify as Muslim.
- Islam: 96%
- Christianity: 3%
- Russian Orthodox Church: 2.5%
- Georgian Orthodox Church: 0.18%
- Judaism (including Mountain Jews): 0.11%
It's important to note that while many people identify with these religions, not everyone practices them strictly.
Literacy
Literacy means being able to read and write.
- Definition: People aged 15 and over who can read and write.
- Total population: 98.8%
- Male: 99.5%
- Female: 98.2%
(2003 estimate)
Education Expenditures
This is the percentage of the country's total money earned (Gross Domestic Product or GDP) that is spent on education.
- 2.1% of total GDP
Images for kids
-
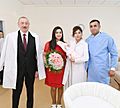
President of Azerbaijan and his wife met with parents of Azerbaijan's 10 millionth citizen

See also
 In Spanish: Demografía de Azerbaiyán para niños
