
Dulwich (UK Parliament constituency) facts for kids
Quick facts for kids {{{Name}}}[[{{{Type}}} constituency]] |
|
|---|---|
| [[Image:{{{Map1}}}Constituency.svg|120px|]] [[Image:England{{{Map2}}}.svg|120px|]] |
|
| {{{Name}}} shown within [[{{{Entity}}}]], and {{{Entity}}} shown within England | |
| Created: | {{{Year}}} |
| MP: | {{{MP}}} |
| Party: | {{{Party}}} |
| Type: | House of Commons |
| County: | [[{{{County}}}]] |
| EP constituency: | [[{{{EP}}} (European Parliament constituency)|{{{EP}}}]] |
Dulwich was a special area in South London that used to elect one person, called a Member of Parliament (MP), to the House of Commons. The House of Commons is where laws are made in the UK Parliament. Think of it like a team that represents a specific part of the country.
This area, or "constituency," was created in 1885. It stopped being a separate constituency in 1997. Most of its area then became part of a new constituency called Dulwich and West Norwood.
Contents
A Look Back: Dulwich's Story
The Dulwich constituency was formed in 1885. It was one of nine new areas created from the larger area of Lambeth. Before 1885, local leaders in Dulwich were often from the Conservative Party.
For a long time, from 1885 to 1945, Dulwich usually voted for the Conservative Party. This was because it was a suburban area, meaning it had many houses and families who often supported the Conservatives.
However, in 1945, the Labour Party won the election in Dulwich. After that, the seat became a "marginal seat." This means that the elections were very close, and sometimes the Labour Party won, and sometimes the Conservative Party won. It was a real competition! In 1892, a Liberal candidate noted that even though Dulwich was known for its big "villa" houses, many voters lived in smaller homes.
What Were the Boundaries?
The "boundaries" of a constituency are like its borders, showing exactly which streets and neighborhoods are included. These boundaries can change over time due to population shifts or new laws.

- 1885–1918: The Dulwich constituency included parts of Camberwell and the small area of Penge.

- 1918–1950: Penge was moved to a different constituency. Dulwich then included specific wards (smaller local areas) within the Metropolitan Borough of Camberwell.

- 1950–1974: The boundaries changed again to include more wards from the Metropolitan Borough of Camberwell.
- 1974–1997: The constituency's boundaries were updated to include wards within the London Borough of Southwark.
Who Were the Members of Parliament?
An MP is a person elected by the people in their constituency to represent them in Parliament. They speak up for their area and help make decisions for the whole country. Sometimes, if an MP leaves their job before the next general election, a "by-election" is held just for that constituency to choose a new MP.
Here is a list of the MPs who represented Dulwich:
| Election | Member | Party | |
|---|---|---|---|
| 1885 | John Morgan Howard | Conservative | |
| 1887 by-election | Sir John Blundell Maple | Conservative | |
| 1903 by-election | Frederick Rutherfoord Harris | Conservative | |
| 1906 by-election | Bonar Law | Conservative | |
| 1910 | Sir Frederick Hall | Conservative | |
| 1932 by-election | Sir Bracewell Smith | Conservative | |
| 1945 | Wilfrid Vernon | Labour | |
| 1951 | Robert Jenkins | Conservative | |
| 1964 | Samuel Silkin | Labour | |
| 1983 | Gerald Bowden | Conservative | |
| 1992 | Tessa Jowell | Labour | |
| 1997 | constituency abolished: see Dulwich & West Norwood | ||
Election Results
Elections are how people choose their MPs. Each candidate gets a certain number of votes, and the person with the most votes wins. The "percentage" shows how much of the total vote each candidate received. The "majority" is how many more votes the winner got than the second-place candidate. "Turnout" is the percentage of people who voted.
1990s Elections
| General election 1992: Dulwich | |||||
|---|---|---|---|---|---|
| Party | Candidate | Votes | % | ±% | |
| Labour | Tessa Jowell | 17,714 | 47.3 | +5.3 | |
| Conservative | Gerald Bowden | 15,658 | 41.8 | −0.6 | |
| Liberal Democrats | Alex Goldie | 4,078 | 10.9 | −3.6 | |
| Majority | 2,056 | 5.5 | N/A | ||
| Turnout | 37,450 | 67.8 | −1.5 | ||
| Labour gain from Conservative | Swing | +3.0 | |||
1980s Elections
| General election 1987: Dulwich | |||||
|---|---|---|---|---|---|
| Party | Candidate | Votes | % | ±% | |
| Conservative | Gerald Bowden | 16,563 | 42.4 | +1.8 | |
| Labour | Kate Hoey | 16,383 | 42.0 | +6.3 | |
| SDP | Andrew Harris | 5,664 | 14.5 | −7.5 | |
| Green (UK) | Alex Goldie | 432 | 1.1 | +0.5 | |
| Majority | 180 | 0.4 | -4.5 | ||
| Turnout | 39,042 | 69.3 | |||
| Conservative hold | Swing | N/A | |||
1970s Elections
| General election October 1974: Dulwich | |||||
|---|---|---|---|---|---|
| Party | Candidate | Votes | % | ±% | |
| Labour | Samuel Silkin | 21,790 | 49.5 | +4.0 | |
| Conservative | Eric Morley | 14,331 | 32.6 | −2.1 | |
| Liberal | William H Pearson | 7,866 | 17.9 | −2.0 | |
| Majority | 7,459 | 17.0 | +6.2 | ||
| Turnout | 43,987 | ||||
| Labour hold | Swing | ||||
1960s Elections
| General election 1964: Dulwich | |||||
|---|---|---|---|---|---|
| Party | Candidate | Votes | % | ±% | |
| Labour | Samuel Silkin | 22,320 | 46.86 | +4.0 | |
| Conservative | Martin Stevens | 19,415 | 40.76 | −6.3 | |
| Liberal | Fred G Redman | 5,627 | 11.81 | +1.78 | |
| Christian Socialist | Frederick Palmer | 264 | 0.56 | New | |
| Majority | 2,905 | 6.10 | N/A | ||
| Turnout | 47,626 | ||||
| Labour gain from Conservative | Swing | ||||
Images for kids
-
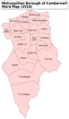
A map showing the wards of Camberwell Metropolitan Borough in 1916.
-
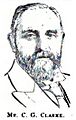
Charles Goddard Clarke, a Liberal candidate for Dulwich in 1895.


See also
- 1887 Dulwich by-election
- 1903 Dulwich by-election
- 1906 Dulwich by-election
- 1932 Dulwich by-election
- Southwark local elections
