Forman, North Dakota facts for kids
Quick facts for kids
Forman, North Dakota
|
|
|---|---|

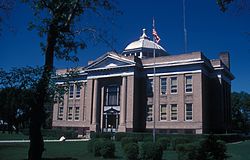
County Courthouse
|
|

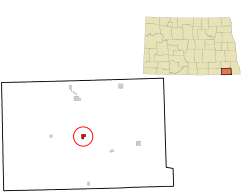
Location of Forman, North Dakota
|
|
| Country | United States |
| State | North Dakota |
| County | Sargent |
| Founded | 1883 |
| Area | |
| • Total | 0.79 sq mi (2.04 km2) |
| • Land | 0.78 sq mi (2.02 km2) |
| • Water | 0.01 sq mi (0.02 km2) |
| Elevation | 1,257 ft (383 m) |
| Population
(2020)
|
|
| • Total | 509 |
| • Estimate
(2022)
|
493 |
| • Density | 653.40/sq mi (252.33/km2) |
| Time zone | UTC-6 (Central (CST)) |
| • Summer (DST) | UTC-5 (CDT) |
| ZIP code |
58032
|
| Area code(s) | 701 |
| FIPS code | 38-27260 |
| GNIS feature ID | 1036039 |
Forman is a small city in North Dakota, United States. It is the main town, or county seat, of Sargent County, North Dakota. In 2020, about 509 people lived there. Forman was started in 1883.
Contents
Forman's Early Days: A City's History
Forman was founded in 1883 by a person named Cornelius Forman. Just three years later, in 1886, it became the county seat for Sargent County. This means it became the main town where the county government offices are located. Before Forman, the county seat was in a place called Minor.
For many years, Forman was special because it was the only town in North Dakota. Other places were called either villages or cities. This was due to a unique legal process. However, in 1967, the state government decided that all incorporated communities would be called cities. So, Forman officially became a city like the rest.
Exploring Forman's Geography and Climate
Forman is located around a small body of water called Lake Lithia. The city covers a total area of about 2.04 square kilometers (0.79 square miles). Most of this area is land, with a small part being water.
Weather Patterns in Forman
Forman experiences a wide range of weather throughout the year. Summers can be quite warm, while winters are very cold. The city also gets a good amount of rain, especially in the summer months.
| Climate data for Forman 5 SSE, North Dakota (1991–2020 normals, extremes 1893–present) | |||||||||||||
|---|---|---|---|---|---|---|---|---|---|---|---|---|---|
| Month | Jan | Feb | Mar | Apr | May | Jun | Jul | Aug | Sep | Oct | Nov | Dec | Year |
| Record high °F (°C) | 65 (18) |
67 (19) |
84 (29) |
99 (37) |
103 (39) |
105 (41) |
110 (43) |
107 (42) |
102 (39) |
97 (36) |
82 (28) |
64 (18) |
110 (43) |
| Mean daily maximum °F (°C) | 18.3 (−7.6) |
23.2 (−4.9) |
36.5 (2.5) |
52.9 (11.6) |
66.4 (19.1) |
75.9 (24.4) |
81.0 (27.2) |
79.7 (26.5) |
71.4 (21.9) |
55.7 (13.2) |
38.4 (3.6) |
24.6 (−4.1) |
52.0 (11.1) |
| Daily mean °F (°C) | 8.9 (−12.8) |
13.3 (−10.4) |
26.5 (−3.1) |
41.8 (5.4) |
55.2 (12.9) |
65.4 (18.6) |
70.2 (21.2) |
68.1 (20.1) |
59.1 (15.1) |
44.6 (7.0) |
29.0 (−1.7) |
15.8 (−9.0) |
41.5 (5.3) |
| Mean daily minimum °F (°C) | −0.6 (−18.1) |
3.4 (−15.9) |
16.5 (−8.6) |
30.7 (−0.7) |
43.9 (6.6) |
55.0 (12.8) |
59.3 (15.2) |
56.5 (13.6) |
46.8 (8.2) |
33.5 (0.8) |
19.6 (−6.9) |
7.1 (−13.8) |
31.0 (−0.6) |
| Record low °F (°C) | −45 (−43) |
−53 (−47) |
−34 (−37) |
−5 (−21) |
4 (−16) |
24 (−4) |
28 (−2) |
29 (−2) |
11 (−12) |
−6 (−21) |
−28 (−33) |
−36 (−38) |
−53 (−47) |
| Average precipitation inches (mm) | 0.67 (17) |
0.52 (13) |
0.96 (24) |
1.85 (47) |
2.83 (72) |
4.31 (109) |
3.60 (91) |
2.21 (56) |
2.53 (64) |
2.23 (57) |
0.82 (21) |
0.64 (16) |
23.17 (589) |
| Average precipitation days (≥ 0.01 in) | 5.3 | 5.5 | 4.9 | 6.2 | 9.4 | 10.3 | 9.3 | 7.6 | 7.3 | 6.8 | 4.7 | 6.3 | 83.6 |
| Source: NOAA | |||||||||||||
Understanding Forman's Population
The number of people living in Forman has changed over the years. Here's a quick look at how the population has grown and shrunk since 1890:
| Historical population | |||
|---|---|---|---|
| Census | Pop. | %± | |
| 1890 | 178 | — | |
| 1900 | 257 | 44.4% | |
| 1910 | 352 | 37.0% | |
| 1920 | 402 | 14.2% | |
| 1930 | 386 | −4.0% | |
| 1940 | 500 | 29.5% | |
| 1950 | 466 | −6.8% | |
| 1960 | 530 | 13.7% | |
| 1970 | 596 | 12.5% | |
| 1980 | 629 | 5.5% | |
| 1990 | 586 | −6.8% | |
| 2000 | 506 | −13.7% | |
| 2010 | 504 | −0.4% | |
| 2020 | 509 | 1.0% | |
| 2022 (est.) | 493 | −2.2% | |
| U.S. Decennial Census 2020 Census |
|||
Forman's Community in 2010
According to the census from 2010, there were 504 people living in Forman. These people lived in 222 different homes, and 123 of those homes were families. The city had about 255 housing units.
Most of the people living in Forman in 2010 were White (98.6%). A very small number of people were African American, Native American, or Pacific Islander. Some people were also from other backgrounds or a mix of two or more races. About 1.2% of the population identified as Hispanic or Latino.
Out of the 222 homes, about 24% had children under 18 living there. Nearly half of the homes (48.6%) were married couples living together. A small number of homes had a single parent, either a mother (4.1%) or a father (2.7%). About 44.6% of homes were not families, meaning individuals living alone or with roommates.
Many homes (41.9%) had just one person living there. About 25.2% of homes had someone living alone who was 65 years old or older. On average, there were about 2.10 people per home and 2.87 people per family.
The average age of people in Forman in 2010 was 46.8 years old. About 22% of residents were under 18. About 27% were 65 years old or older. The population was almost evenly split between males (50.8%) and females (49.2%).
See also
 In Spanish: Forman (Dakota del Norte) para niños
 | Selma Burke |
 | Pauline Powell Burns |
 | Frederick J. Brown |
 | Robert Blackburn |

