
Fort Liard facts for kids
Quick facts for kids
Fort Liard
Echaot'l Koe or Acho Dene Kue
|
|
|---|---|

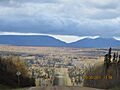
The Sleeping Giant – the view from the top of the hill heading into the Hamlet
|
|

Fort Liard
Location in Northwest Territories

Fort Liard
Location in Canada
|
|
| Country | Canada |
| Territory | Northwest Territories |
| Region | Dehcho Region |
| Constituency | Nahendeh |
| Census division | Region 4 |
| Incorporated (hamlet) | 1 April 1987 |
| Area | |
| • Land | 67.61 km2 (26.10 sq mi) |
| Elevation | 216 m (709 ft) |
| Population
(2021)
|
|
| • Total | 468 |
| • Density | 6.9/km2 (18/sq mi) |
| Time zone | UTC−07:00 (MST) |
| • Summer (DST) | UTC−06:00 (MDT) |
| Canadian Postal code |
X0G 0A0
|
| Area code(s) | 867 |
| Telephone exchange | 770 |
| – Living cost (2018) | 132.5 |
| – Food price index (2019) | 145.4 |
| Website | www.fortliard.com |
| Sources: Department of Municipal and Community Affairs, Prince of Wales Northern Heritage Centre, Canada Flight Supplement 2018 figure based on Edmonton = 100 2019 figure based on Yellowknife = 100 |
|
Fort Liard is a small community, called a hamlet, in the Northwest Territories, Canada. Its name in the Slavey language is Echaot'l Koe or Acho Dene Kue, which means "people from the land of the giants." It is located about 37 kilometers north of the British Columbia border. Getting to Fort Liard by road became possible in 1984. This happened when the Liard Highway was finished.
Fort Liard has important services for its residents. There are two general stores where people can buy everyday items. The "Echo Dene School" teaches students from kindergarten to grade 12. About 150 students attend this school. The community also has a health centre with nurses. The Royal Canadian Mounted Police (RCMP) has a local office here. For fun and activities, there is a recreation centre. It includes a swimming pool, a skating rink, a youth centre, and a multi-court for different sports. You can also find a place to buy fuel like gasoline and propane. A special craft store sells beautiful items made by local artists.
Contents
Fort Liard's Population
Understanding a community often starts with its people. Fort Liard's population changes over time.
How Many People Live Here?
In the 2021 Census, 468 people lived in Fort Liard. They lived in 170 homes. This was a small decrease from 500 people in 2016. The land area of Fort Liard is about 67.61 square kilometers. This means there are about 6.9 people living in each square kilometer.
Indigenous Peoples in Fort Liard
In the 2016 Census, most of the people in Fort Liard were Indigenous. Out of 500 people, 445 were either First Nations or Métis. This shows the strong Indigenous heritage of the community.
| Fort Liard's Population History | ||
|---|---|---|
| Year | Pop. | ±% |
| 1976 | 299 | — |
| 1981 | 405 | +35.5% |
| 1986 | 395 | −2.5% |
| 1991 | 485 | +22.8% |
| 1996 | 512 | +5.6% |
| 2001 | 530 | +3.5% |
| 2006 | 583 | +10.0% |
| 2011 | 536 | −8.1% |
| 2016 | 500 | −6.7% |
| 2021 | 468 | −6.4% |
| Source: Statistics Canada |
||
| Yearly Population Estimates | |||||||||||||||||||||||||||||||||||||||||||||||||||||||||||||||||||||||||||||||
|---|---|---|---|---|---|---|---|---|---|---|---|---|---|---|---|---|---|---|---|---|---|---|---|---|---|---|---|---|---|---|---|---|---|---|---|---|---|---|---|---|---|---|---|---|---|---|---|---|---|---|---|---|---|---|---|---|---|---|---|---|---|---|---|---|---|---|---|---|---|---|---|---|---|---|---|---|---|---|---|
|
|
||||||||||||||||||||||||||||||||||||||||||||||||||||||||||||||||||||||||||||||
| Sources: NWT Bureau of Statistics (2008–2019), NWT Bureau of Statistics (2001 – 2017) | |||||||||||||||||||||||||||||||||||||||||||||||||||||||||||||||||||||||||||||||
First Nations and Métis Groups
The Dene people in Fort Liard are represented by the Acho Dene Koe Band. The Métis people have their own group called the Fort Liard Metis Local 67. Both of these groups are part of the Deh Cho First Nations Tribal Council. This council helps them work together on important issues.
Fort Liard's Climate
Fort Liard experiences a climate with big temperature changes between seasons.
Understanding the Seasons
The climate here is called a borderline humid continental climate. This means summers can be warm, and winters are very cold. Fort Liard has one of the longest frost-free periods in the Northwest Territories, lasting about 120 days. This means plants can grow for a longer time without frost damage.
Temperature Records
The highest temperature ever recorded in Fort Liard was 35.2 degrees Celsius. This happened on July 13, 2014, and again on June 27, 2021. The coldest temperature ever recorded was a very chilly -46.7 degrees Celsius. This was on January 15, 1974.
| Climate data for Fort Liard (Fort Liard Airport) Climate ID: 2201575; coordinates 60°14′06″N 123°28′01″W / 60.23500°N 123.46694°W; elevation: 215.8 m (708 ft); 1991-2020 normals, extremes 1973–present |
|||||||||||||
|---|---|---|---|---|---|---|---|---|---|---|---|---|---|
| Month | Jan | Feb | Mar | Apr | May | Jun | Jul | Aug | Sep | Oct | Nov | Dec | Year |
| Record high humidex | 7.3 | 14.2 | 18.1 | 23.2 | 29.7 | 37.8 | 38.8 | 37.5 | 30.8 | 24.5 | 9.4 | 14.6 | 38.8 |
| Record high °C (°F) | 14.8 (58.6) |
15.0 (59.0) |
19.9 (67.8) |
25.0 (77.0) |
32.6 (90.7) |
35.2 (95.4) |
35.2 (95.4) |
34.9 (94.8) |
30.5 (86.9) |
26.5 (79.7) |
13.5 (56.3) |
15.3 (59.5) |
35.2 (95.4) |
| Mean daily maximum °C (°F) | −16.7 (1.9) |
−10.1 (13.8) |
−2.4 (27.7) |
8.8 (47.8) |
17.4 (63.3) |
22.0 (71.6) |
23.7 (74.7) |
21.6 (70.9) |
15.3 (59.5) |
4.8 (40.6) |
−8.8 (16.2) |
−15.4 (4.3) |
5.0 (41.0) |
| Daily mean °C (°F) | −20.8 (−5.4) |
−15.7 (3.7) |
−9.4 (15.1) |
2.0 (35.6) |
10.3 (50.5) |
15.4 (59.7) |
17.6 (63.7) |
15.5 (59.9) |
9.6 (49.3) |
0.7 (33.3) |
−12.5 (9.5) |
−19.3 (−2.7) |
−0.5 (31.0) |
| Mean daily minimum °C (°F) | −24.9 (−12.8) |
−21.3 (−6.3) |
−16.3 (2.7) |
−4.7 (23.5) |
3.2 (37.8) |
8.8 (47.8) |
11.4 (52.5) |
9.4 (48.9) |
3.9 (39.0) |
−3.4 (25.9) |
−16.3 (2.7) |
−23.1 (−9.6) |
−6.1 (21.0) |
| Record low °C (°F) | −46.7 (−52.1) |
−44.0 (−47.2) |
−39.8 (−39.6) |
−31.6 (−24.9) |
−14.5 (5.9) |
−1.6 (29.1) |
−0.1 (31.8) |
−1.7 (28.9) |
−11.7 (10.9) |
−30.0 (−22.0) |
−43.0 (−45.4) |
−45.0 (−49.0) |
−46.7 (−52.1) |
| Record low wind chill | −63 | −52 | −48 | −36 | −18 | 0 | 0 | −3 | −17 | −33 | −53 | −55 | −63 |
| Average precipitation mm (inches) | 27.0 (1.06) |
19.3 (0.76) |
15.2 (0.60) |
15.9 (0.63) |
39.5 (1.56) |
71.3 (2.81) |
82.2 (3.24) |
54.0 (2.13) |
43.4 (1.71) |
27.4 (1.08) |
31.0 (1.22) |
22.9 (0.90) |
449.1 (17.7) |
| Average rainfall mm (inches) | 0.0 (0.0) |
0.0 (0.0) |
0.1 (0.00) |
3.3 (0.13) |
37.2 (1.46) |
61.1 (2.41) |
88.0 (3.46) |
50.5 (1.99) |
45.4 (1.79) |
10.8 (0.43) |
0.1 (0.00) |
0.0 (0.0) |
296.5 (11.67) |
| Average snowfall cm (inches) | 30.5 (12.0) |
22.8 (9.0) |
17.0 (6.7) |
12.2 (4.8) |
1.9 (0.7) |
0.0 (0.0) |
0.0 (0.0) |
0.0 (0.0) |
2.0 (0.8) |
16.8 (6.6) |
35.4 (13.9) |
26.7 (10.5) |
165.3 (65) |
| Average precipitation days (≥ 0.2 mm) | 9.2 | 7.7 | 7.0 | 4.9 | 9.8 | 10.7 | 12.3 | 12.2 | 10.9 | 8.6 | 10.1 | 8.1 | 111.5 |
| Average rainy days (≥ 0.2 mm) | 0.0 | 0.0 | 0.06 | 1.8 | 8.9 | 9.7 | 11.5 | 10.8 | 10.8 | 3.9 | 0.13 | 0.0 | 57.59 |
| Average snowy days (≥ 0.2 cm) | 9.0 | 7.4 | 7.5 | 3.2 | 1.0 | 0.0 | 0.0 | 0.0 | 0.76 | 5.4 | 10.1 | 7.4 | 51.76 |
| Average relative humidity (%) | 70.9 | 62.9 | 49.6 | 40.7 | 37.4 | 46.7 | 49.8 | 51.3 | 53.0 | 66.4 | 74.9 | 74.8 | 56.5 |
| Source: Environment and Climate Change Canada | |||||||||||||
Images for kids
-
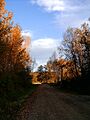
Beautiful Autumn Colors
-
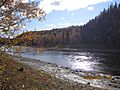
Petitot River just before it meets the Liard River
-
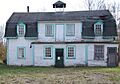
Roman Catholic Church
-
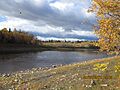
Petiot River looking toward the Liard River
-
The Sleeping Giant in Fall


