Geography of Louisville, Kentucky facts for kids
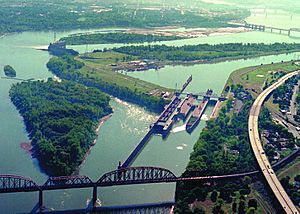
Louisville is a big city in Kentucky, a state in the United States. It's found right by the Falls of the Ohio River, which are like natural steps in the river.
Louisville is located at 38°13′31″N 85°44′30″W / 38.225371°N 85.741613°W. The city and its surrounding area, called Louisville Metro, cover about 398 square miles (1,030 square kilometers). Most of this area is land, but a small part is covered by water.
Contents
What Does Louisville's Land Look Like?

Even though the ground and rocks officially place Louisville in the outer Bluegrass region, the city's land is mostly a very wide part of the Ohio River's flood plain. Think of a flood plain as a flat area next to a river that can get covered with water when the river overflows.
Louisville's valley sits between two higher areas, called plateaus. One is a karst plateau in Southern Indiana, and the other is the Bluegrass plateau in Kentucky. Both are about 900 feet (274 meters) high. The land drops sharply from the Indiana plateau, but it rises more slowly towards the Bluegrass plateau.
How High is the Land in Louisville?
The flood plain stretches much longer from north to south than from east to west. For example, areas close to downtown, like the Highlands, are about 540 feet (165 meters) high. These areas are safe from even a thousand-year flood. But some areas 10 miles (16 kilometers) from downtown, like Fairdale and Okolona, are at the same low elevation as downtown.
Many areas in the east part of the city are higher, from 600 to 700 feet (183 to 213 meters). This higher land, combined with winds that usually blow from the east, can sometimes trap heat and pollution in the city.
How Louisville's Land Changed Over Time
Areas west of I-65 are very flat. This is because the Ohio River used to flow through here a long time ago. The ground in these areas is made of hard rocks. Before cities were built, much of this land was wetlands, which are like swampy areas. Early roads here were even made of wooden planks! You can still see this history in some street names, like Poplar Level Road.
In the 1950s, when places like Standiford Field airport were built, many small streams in this flat area were changed into ditches. This helped with the poor drainage and frequent flooding.
Areas east of I-65 were generally not part of the old flood plain. These areas have gentle rolling hills made of soft soil. That's why roads here, like Eastern Parkway, can get a lot of potholes.
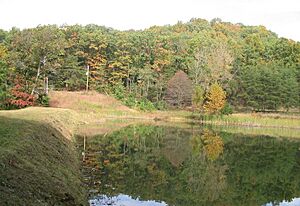
The southern part of Jefferson County is a beautiful, rugged area called the Knobs region. This part of the county has not been developed much and is mostly parkland, including the Jefferson Memorial Forest. The eastern third of the county is in the Eden Shale Hills section of the Bluegrass region. It has also seen less building than the flood plain, but that is starting to change.
What's the Weather Like in Louisville?
| Weather chart for Louisville | |||||||||||||||||||||||||||||||||||||||||||||||
|---|---|---|---|---|---|---|---|---|---|---|---|---|---|---|---|---|---|---|---|---|---|---|---|---|---|---|---|---|---|---|---|---|---|---|---|---|---|---|---|---|---|---|---|---|---|---|---|
| J | F | M | A | M | J | J | A | S | O | N | D | ||||||||||||||||||||||||||||||||||||
|
3.2
43
27
|
3.2
48
30
|
4.2
58
38
|
4
69
47
|
5.3
77
57
|
3.8
85
66
|
4.2
89
70
|
3.3
88
69
|
3.1
81
60
|
3.2
70
49
|
3.6
58
40
|
3.8
46
30
|
||||||||||||||||||||||||||||||||||||
| temperatures in °F precipitation totals in inches source: NOAA |
|||||||||||||||||||||||||||||||||||||||||||||||
|
Metric conversion
|
|||||||||||||||||||||||||||||||||||||||||||||||
Louisville has a humid subtropical climate. This means it has four clear seasons. Spring usually starts in mid-to-late March, and summer lasts from mid-to-late May to late September. Fall is in October and November.
Sometimes, the weather can be extreme in early spring and late fall. Severe weather, like tornado outbreaks, can happen in the region. Winter usually brings a mix of rain, sleet, and snow. Heavy snowfall and ice storms can also occur.
Temperatures and Rainfall in Louisville
On average, Louisville has about 5.8 days a year where the temperature drops to 10°F (-12°C). Temperatures of 0°F (-18°C) or below happen only every few years. The ground usually freezes between October 31 and April 6, giving a growing season of 207 days for plants.
Summers are often hazy, hot, and humid. Temperatures can stay between 90°F (32°C) and 100°F (38°C) for long periods, and sometimes there are droughts. Louisville averages 35 days a year with temperatures at or above 90°F (32°C). The average yearly temperature is 58.2°F (14.6°C).
Louisville gets about 12.5 inches (31.8 cm) of snow each winter and about 44.9 inches (114 cm) of rain each year. The first snow usually falls around December 8, and the last around March 12. The most rain in one day was 10.48 inches (26.6 cm) on March 1, 1997. The most snow in 24 hours was 15.5 inches (39.4 cm).
The wettest seasons are spring and summer, but it rains fairly steadily all year. January is the coldest month, with an average temperature of 34.9°F (1.6°C). July is the hottest month, averaging 79.3°F (26.3°C). The hottest temperature ever recorded was 107°F (42°C) on July 14, 1936. The coldest was -22°F (-30°C) on January 19, 1994.
The Urban Heat Island Effect
Louisville experiences something called the urban heat island effect. This means that temperatures in busy city areas and industrial zones are often higher than in the suburbs. The difference can be as much as 5°F (3°C).
A study in 2012 found that Louisville has one of the highest heat island effects in America. The temperature difference between the city and nearby rural areas has increased by about 1.67°F (0.93°C) every ten years between 1961 and 2010. This is partly because Louisville is in the Ohio River Valley, which can trap still air. Another reason is that there aren't enough trees in the city center. The downtown area has very few trees compared to other cities.
Air Quality in Louisville
Because of its location in the Ohio River Valley, Air pollution can get trapped in Louisville. This means the city sometimes has lower air quality.
| Climate data for Louisville International Airport, Kentucky (1981–2010 normals, extremes 1872–present ) | |||||||||||||
|---|---|---|---|---|---|---|---|---|---|---|---|---|---|
| Month | Jan | Feb | Mar | Apr | May | Jun | Jul | Aug | Sep | Oct | Nov | Dec | Year |
| Record high °F (°C) | 77 (25) |
78 (26) |
88 (31) |
91 (33) |
98 (37) |
105 (41) |
107 (42) |
105 (41) |
104 (40) |
93 (34) |
85 (29) |
76 (24) |
107 (42) |
| Mean maximum °F (°C) | 64.7 (18.2) |
69.4 (20.8) |
78.5 (25.8) |
84.2 (29.0) |
87.8 (31.0) |
92.9 (33.8) |
95.5 (35.3) |
95.7 (35.4) |
91.8 (33.2) |
84.3 (29.1) |
75.3 (24.1) |
65.3 (18.5) |
97.0 (36.1) |
| Mean daily maximum °F (°C) | 43.0 (6.1) |
47.8 (8.8) |
57.9 (14.4) |
68.8 (20.4) |
77.1 (25.1) |
85.3 (29.6) |
88.7 (31.5) |
88.3 (31.3) |
81.5 (27.5) |
70.1 (21.2) |
57.9 (14.4) |
45.8 (7.7) |
67.8 (19.9) |
| Mean daily minimum °F (°C) | 26.8 (−2.9) |
29.9 (−1.2) |
37.8 (3.2) |
47.3 (8.5) |
57.0 (13.9) |
66.0 (18.9) |
69.9 (21.1) |
68.5 (20.3) |
60.5 (15.8) |
48.9 (9.4) |
39.5 (4.2) |
30.0 (−1.1) |
48.6 (9.2) |
| Mean minimum °F (°C) | 4.9 (−15.1) |
10.2 (−12.1) |
20.1 (−6.6) |
30.4 (−0.9) |
41.0 (5.0) |
52.1 (11.2) |
58.7 (14.8) |
57.2 (14.0) |
44.7 (7.1) |
32.8 (0.4) |
23.0 (−5.0) |
9.2 (−12.7) |
0.2 (−17.7) |
| Record low °F (°C) | −22 (−30) |
−19 (−28) |
−1 (−18) |
21 (−6) |
31 (−1) |
42 (6) |
49 (9) |
45 (7) |
33 (1) |
23 (−5) |
−1 (−18) |
−15 (−26) |
−22 (−30) |
| Average precipitation inches (mm) | 3.24 (82) |
3.18 (81) |
4.17 (106) |
4.01 (102) |
5.27 (134) |
3.79 (96) |
4.23 (107) |
3.33 (85) |
3.05 (77) |
3.22 (82) |
3.59 (91) |
3.83 (97) |
44.91 (1,141) |
| Average snowfall inches (cm) | 3.7 (9.4) |
4.5 (11) |
1.4 (3.6) |
0.1 (0.25) |
0 (0) |
0 (0) |
0 (0) |
0 (0) |
0 (0) |
0.1 (0.25) |
0.1 (0.25) |
2.6 (6.6) |
12.5 (32) |
| Average precipitation days (≥ 0.01 in) | 10.4 | 10.1 | 11.9 | 11.7 | 12.6 | 10.3 | 10.0 | 8.0 | 8.0 | 7.7 | 10.1 | 12.0 | 122.8 |
| Average snowy days (≥ 0.1 in) | 3.6 | 3.6 | 1.2 | 0.1 | 0 | 0 | 0 | 0 | 0 | 0.1 | 0.3 | 2.9 | 11.8 |
| Average relative humidity (%) | 68.6 | 68.1 | 64.0 | 61.5 | 67.2 | 68.9 | 70.9 | 71.7 | 72.9 | 69.9 | 69.4 | 70.2 | 68.6 |
| Mean monthly sunshine hours | 140.5 | 148.9 | 188.6 | 221.1 | 263.4 | 288.9 | 293.6 | 272.6 | 234.3 | 208.5 | 135.7 | 118.3 | 2,514.4 |
| Percent possible sunshine | 46 | 49 | 51 | 56 | 60 | 65 | 65 | 65 | 63 | 60 | 45 | 40 | 56 |
| Source: NOAA (sun 1961–1990) | |||||||||||||
 | Roy Wilkins |
 | John Lewis |
 | Linda Carol Brown |


