Glen St. Mary, Florida facts for kids
Quick facts for kids
Glen St. Mary, Florida
|
|
|---|---|
| Town of Glen St. Mary | |

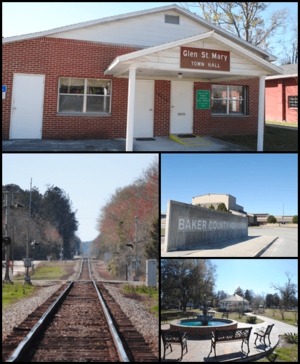
Top, left to right: Glen St. Mary Town Hall, CSX Tallahassee Subdivision railroad, Baker County High School, Celebration Park
|
|

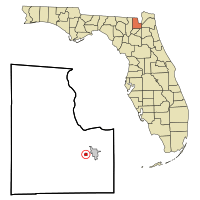
Location in Baker County and the state of Florida
|
|
| Country | |
| State | |
| County | Baker |
| Settled (Cotton Field) | c. 1829-1881 |
| Incorporated (Town of Glen St. Mary) | 1957 |
| Government | |
| • Type | Mayor-Council |
| Area | |
| • Total | 0.46 sq mi (1.19 km2) |
| • Land | 0.46 sq mi (1.19 km2) |
| • Water | 0.00 sq mi (0.00 km2) |
| Elevation | 131 ft (40 m) |
| Population
(2020)
|
|
| • Total | 463 |
| • Density | 1,010.92/sq mi (390.47/km2) |
| Time zone | UTC-5 (Eastern (EST)) |
| • Summer (DST) | UTC-4 (EDT) |
| ZIP code |
32040
|
| FIPS code | 12-26075 |
| GNIS feature ID | 0283111 |
Glen St. Mary is a small town located in Baker County, Florida, in the United States. It's part of the larger Jacksonville area in North Florida. In 2020, about 463 people lived there, which was a small increase from 437 people in 2010.
Contents
Where is Glen St. Mary?
Glen St. Mary is located at these coordinates: 30°16′34″N 82°9′41″W / 30.27611°N 82.16139°W.
You can find U.S. Route 90 (also known as Mount Vernon Avenue) running right through the middle of town. Interstate 10 passes just south of the town, and you can get there from Exit 333 (Baker County Road 125).
According to the United States Census Bureau, the town covers an area of about 0.4 square miles (1.19 square kilometers). All of this area is land.
What's the Weather Like?
The weather in Glen St. Mary is usually hot and humid in the summer. Winters are generally mild. This type of weather is called a humid subtropical climate.
| Climate data for Glen St. Mary, Florida, 1991–2020 normals, extremes 1919–present | |||||||||||||
|---|---|---|---|---|---|---|---|---|---|---|---|---|---|
| Month | Jan | Feb | Mar | Apr | May | Jun | Jul | Aug | Sep | Oct | Nov | Dec | Year |
| Record high °F (°C) | 89 (32) |
89 (32) |
91 (33) |
95 (35) |
102 (39) |
104 (40) |
102 (39) |
100 (38) |
99 (37) |
97 (36) |
90 (32) |
86 (30) |
104 (40) |
| Mean maximum °F (°C) | 79.6 (26.4) |
81.9 (27.7) |
85.3 (29.6) |
88.6 (31.4) |
93.0 (33.9) |
96.4 (35.8) |
96.2 (35.7) |
95.4 (35.2) |
93.2 (34.0) |
89.3 (31.8) |
84.6 (29.2) |
81.0 (27.2) |
97.8 (36.6) |
| Mean daily maximum °F (°C) | 67.1 (19.5) |
70.6 (21.4) |
75.9 (24.4) |
81.7 (27.6) |
87.6 (30.9) |
91.1 (32.8) |
92.8 (33.8) |
91.8 (33.2) |
88.8 (31.6) |
82.5 (28.1) |
75.0 (23.9) |
69.4 (20.8) |
81.2 (27.3) |
| Daily mean °F (°C) | 53.5 (11.9) |
57.1 (13.9) |
61.8 (16.6) |
67.5 (19.7) |
74.2 (23.4) |
79.8 (26.6) |
82.0 (27.8) |
81.6 (27.6) |
78.6 (25.9) |
70.6 (21.4) |
62.1 (16.7) |
56.2 (13.4) |
68.7 (20.4) |
| Mean daily minimum °F (°C) | 40.0 (4.4) |
43.7 (6.5) |
47.7 (8.7) |
53.3 (11.8) |
60.7 (15.9) |
68.5 (20.3) |
71.2 (21.8) |
71.4 (21.9) |
68.3 (20.2) |
58.7 (14.8) |
49.2 (9.6) |
42.9 (6.1) |
56.3 (13.5) |
| Mean minimum °F (°C) | 23.6 (−4.7) |
26.7 (−2.9) |
30.0 (−1.1) |
38.0 (3.3) |
47.2 (8.4) |
59.8 (15.4) |
64.9 (18.3) |
64.8 (18.2) |
57.7 (14.3) |
41.8 (5.4) |
30.6 (−0.8) |
27.6 (−2.4) |
21.4 (−5.9) |
| Record low °F (°C) | 7 (−14) |
14 (−10) |
9 (−13) |
27 (−3) |
37 (3) |
45 (7) |
54 (12) |
52 (11) |
40 (4) |
29 (−2) |
18 (−8) |
9 (−13) |
7 (−14) |
| Average precipitation inches (mm) | 3.68 (93) |
3.51 (89) |
3.71 (94) |
3.10 (79) |
2.87 (73) |
8.42 (214) |
6.76 (172) |
7.12 (181) |
5.84 (148) |
3.65 (93) |
1.93 (49) |
2.63 (67) |
53.22 (1,352) |
| Average precipitation days (≥ 0.01 in) | 8.2 | 7.6 | 7.7 | 5.9 | 6.3 | 13.5 | 13.9 | 14.5 | 10.2 | 6.8 | 5.5 | 6.2 | 106.3 |
| Source: NOAA | |||||||||||||
How Many People Live Here?
| Historical population | |||
|---|---|---|---|
| Census | Pop. | %± | |
| 1960 | 329 | — | |
| 1970 | 357 | 8.5% | |
| 1980 | 462 | 29.4% | |
| 1990 | 480 | 3.9% | |
| 2000 | 473 | −1.5% | |
| 2010 | 437 | −7.6% | |
| 2020 | 463 | 5.9% | |
| U.S. Decennial Census | |||
Population Changes (2010 and 2020)
The table below shows the different groups of people living in Glen St. Mary during the 2010 and 2020 census.
| Race | Pop 2010 | Pop 2020 | % 2010 | % 2020 |
|---|---|---|---|---|
| White (NH) | 407 | 412 | 93.14% | 88.98% |
| Black or African American (NH) | 10 | 17 | 2.29% | 3.67% |
| Native American or Alaska Native (NH) | 2 | 0 | 0.46% | 0.00% |
| Asian (NH) | 3 | 0 | 0.69% | 0.00% |
| Pacific Islander or Native Hawaiian (NH) | 0 | 0 | 0.00% | 0.00% |
| Some other race (NH) | 0 | 0 | 0.00% | 0.00% |
| Two or more races/Multiracial (NH) | 7 | 21 | 1.60% | 4.54% |
| Hispanic or Latino (any race) | 8 | 13 | 1.83% | 2.81% |
| Total | 437 | 463 |
In 2020, there were 463 people living in Glen St. Mary. These people made up 238 households, with 162 of those being families.
Back in 2010, the town had 437 people. There were 203 households, and 163 of them were families.
Schools in Glen St. Mary
The public schools in Glen St. Mary are managed by the Baker County School District.
- Baker County High School is located right in Glen St. Mary. Its address is 1 Wildcat Drive.
See also
In Spanish: Glen St. Mary para niños
 | John T. Biggers |
 | Thomas Blackshear |
 | Mark Bradford |
 | Beverly Buchanan |

