Henrieville, Utah facts for kids
Quick facts for kids
Henrieville, Utah
|
|
|---|---|
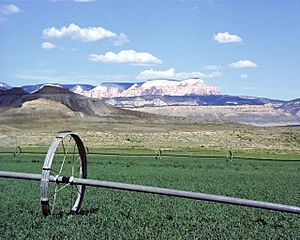
Rolling irrigation pipes keep fields green in Henrieville.
|
|
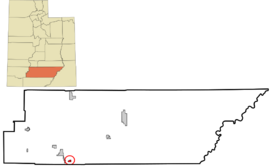
Location in Garfield County and state of Utah
|
|
| Country | United States |
| State | Utah |
| County | Garfield |
| Settled | 1878 |
| Incorporated | 1934 |
| Named for | James Henrie |
| Area | |
| • Total | 1.34 sq mi (3.48 km2) |
| • Land | 1.34 sq mi (3.48 km2) |
| • Water | 0.00 sq mi (0.00 km2) |
| Elevation | 5,998 ft (1,828 m) |
| Population
(2020)
|
|
| • Total | 221 |
| • Estimate
(2019)
|
225 |
| • Density | 167.29/sq mi (64.58/km2) |
| Time zone | UTC-7 (Mountain (MST)) |
| • Summer (DST) | UTC-6 (MDT) |
| ZIP code |
84736
|
| Area code(s) | 435 |
| FIPS code | 49-34750 |
| GNIS feature ID | 1428663 |
| State Routes | |
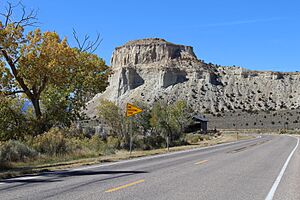
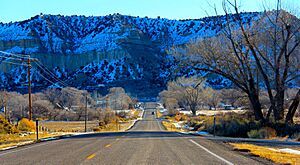
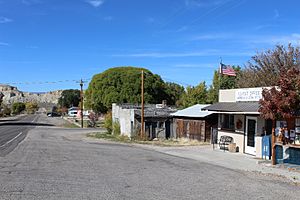
Henrieville is a small town in Garfield County, Utah, United States. It is located along Utah Scenic Byway 12, a very scenic road. In 2020, about 221 people lived there.
The town was named after James Henrie, who was an important leader in the Mormon community.
Contents
Exploring Henrieville's Location
Henrieville is found in the southern part of Garfield County. It sits right on Utah State Route 12, which is a famous scenic highway. The town is about 15 miles (24 km) southeast of Bryce Canyon City. It is also about 30 miles (48 km) southwest of Escalante.
The closest town to Henrieville is Cannonville, which is only about 3.5 miles (5.6 km) to the west on Route 12. The United States Census Bureau says that Henrieville covers a total area of 1.34 square miles (3.48 square kilometers). All of this area is land.
Henrieville's Weather and Climate
The weather in Henrieville usually has mild differences between the highest and lowest temperatures. It also gets enough rain throughout the year. According to the Köppen Climate Classification system, Henrieville has a hot and cold desert climate. This type of climate is often called "BWk" on climate maps.
| Climate data for Henrieville, Utah | |||||||||||||
|---|---|---|---|---|---|---|---|---|---|---|---|---|---|
| Month | Jan | Feb | Mar | Apr | May | Jun | Jul | Aug | Sep | Oct | Nov | Dec | Year |
| Mean daily maximum °F (°C) | 42.4 (5.8) |
48.0 (8.9) |
54.0 (12.2) |
61.5 (16.4) |
71.8 (22.1) |
82.6 (28.1) |
88.2 (31.2) |
85.5 (29.7) |
77.5 (25.3) |
67.8 (19.9) |
52.0 (11.1) |
43.5 (6.4) |
64.6 (18.1) |
| Daily mean °F (°C) | 29.5 (−1.4) |
33.6 (0.9) |
37.6 (3.1) |
44.8 (7.1) |
54.7 (12.6) |
63.0 (17.2) |
70.3 (21.3) |
68.2 (20.1) |
60.4 (15.8) |
53.1 (11.7) |
39.4 (4.1) |
28.2 (−2.1) |
48.6 (9.2) |
| Mean daily minimum °F (°C) | 13.5 (−10.3) |
18.7 (−7.4) |
23.4 (−4.8) |
28.6 (−1.9) |
36.0 (2.2) |
44.2 (6.8) |
51.6 (10.9) |
49.6 (9.8) |
42.1 (5.6) |
33.3 (0.7) |
21.7 (−5.7) |
13.5 (−10.3) |
31.4 (−0.4) |
| Average precipitation inches (mm) | 0.8 (21) |
0.8 (20) |
0.9 (23) |
0.7 (18) |
0.7 (17) |
0.4 (11) |
0.9 (24) |
1.3 (34) |
0.9 (24) |
1.0 (25) |
1.1 (27) |
0.8 (21) |
10.3 (265) |
| Average snowfall inches (cm) | 9.3 (23.6) |
6.6 (16.8) |
2.8 (7.1) |
2.2 (5.6) |
0 (0) |
0 (0) |
0 (0) |
0 (0) |
0 (0) |
0.4 (1) |
3.1 (7.9) |
5.6 (14.2) |
30 (76.2) |
| Mean daily daylight hours | 10.4 | 11.3 | 12.4 | 13.7 | 14.7 | 15.2 | 14.9 | 14 | 12.8 | 11.6 | 10.6 | 10.1 | 12.6 |
| Source: Weatherbase | |||||||||||||
Who Lives in Henrieville?
| Historical population | |||
|---|---|---|---|
| Census | Pop. | %± | |
| 1900 | 181 | — | |
| 1910 | 158 | −12.7% | |
| 1920 | 170 | 7.6% | |
| 1930 | 207 | 21.8% | |
| 1940 | 241 | 16.4% | |
| 1950 | 114 | −52.7% | |
| 1960 | 152 | 33.3% | |
| 1970 | 145 | −4.6% | |
| 1980 | 167 | 15.2% | |
| 1990 | 163 | −2.4% | |
| 2000 | 159 | −2.5% | |
| 2010 | 230 | 44.7% | |
| 2019 (est.) | 225 | −2.2% | |
| U.S. Decennial Census | |||
In the year 2000, a census counted 159 people living in Henrieville. These people lived in 57 households, and 40 of these were families. The town had about 942 people per square mile (361 per square kilometer). There were 83 homes available, with about 492 homes per square mile (189 per square kilometer).
Most of the people in Henrieville (99.37%) were White. A small number (0.63%) were Native American. About 1.89% of the population identified as Hispanic or Latino.
Out of the 57 households, about 33.3% had children under 18 living with them. Most households (64.9%) were married couples living together. About 7.0% had a female head of household with no husband present. Around 28.1% of households were not families.
About 26.3% of all households had only one person living there. And 17.5% had someone living alone who was 65 years old or older. On average, each household had 2.79 people, and each family had 3.41 people.
The population was spread out by age. About 32.1% were under 18 years old. About 6.3% were between 18 and 24. Another 20.8% were between 25 and 44. About 22.6% were between 45 and 64. Finally, 18.2% were 65 years old or older. The average age in the town was 37 years. For every 100 females, there were about 75 males.
The average income for a household in Henrieville was $28,500. For families, the average income was $35,000. Males earned about $21,667 on average, while females earned about $22,500. The per capita income (income per person) was $12,231. About 4.5% of families and 8.6% of the total population lived below the poverty line. This included 10.2% of those under 18 and 11.1% of those 65 or older.
See also
 In Spanish: Henrieville para niños
 | Lonnie Johnson |
 | Granville Woods |
 | Lewis Howard Latimer |
 | James West |


