Hillcrest, Rockland County, New York facts for kids
Quick facts for kids
Hillcrest, New York
|
|
|---|---|
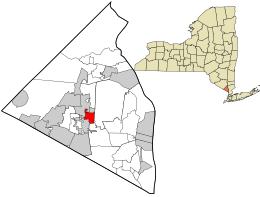
Location in Rockland County and the state of New York.
|
|
| Country | United States |
| State | New York |
| County | Rockland |
| Area | |
| • Total | 1.30 sq mi (3.38 km2) |
| • Land | 1.30 sq mi (3.38 km2) |
| • Water | 0.00 sq mi (0.00 km2) |
| Elevation | 512 ft (156 m) |
| Population
(2020)
|
|
| • Total | 8,164 |
| • Density | 6,255.94/sq mi (2,415.46/km2) |
| Time zone | UTC-5 (Eastern (EST)) |
| • Summer (DST) | UTC-4 (EDT) |
| FIPS code | 36-34693 |
| GNIS feature ID | 0952813 |
Hillcrest is a small community in Rockland County, New York. It is called a hamlet and a census-designated place. This means it's a small area that the government tracks for population numbers. Hillcrest was officially formed in 1893.
It is located in the town of Ramapo. You can find it north of Spring Valley and west of New City. In 2020, about 8,164 people lived there.
Many people who live in Hillcrest travel to New York City for work. They often go to Manhattan by bus, train, or car. This makes Hillcrest a "bedroom suburb." Most of its mail goes through the Spring Valley post office.
Contents
History of Hillcrest
Early Days as a Summer Spot
In the early 1900s, Hillcrest was a popular summer getaway. Families from New York City would come here. They could travel by train from New Jersey. Then they would take a ferry across the Hudson River.
The Tappan Zee Bridge Opens
In 1955, the Tappan Zee Bridge opened. This bridge connected Tarrytown (in Westchester County) to Nyack (in Rockland County). The bridge made it much easier to get to Hillcrest. It also made it simpler for people to travel to New York City.
Changes in Population
After the bridge opened, many people started moving to Hillcrest. From the 1950s to the 1970s, many families moved from New York City to suburban areas like Hillcrest. They were looking for more space and a different lifestyle.
In the 1960s, many Jewish families moved to Hillcrest. They came from places like Brooklyn and The Bronx in New York City. They wanted affordable first homes. They also liked the short commute to the city and the suburban feel.
New Neighbors and Community Shifts
By the 1990s, more new people moved to Hillcrest. These included immigrants from Asia and the Caribbean. Other new residents came from Brooklyn and The Bronx. They were looking for the same things as earlier families: affordable homes and a suburban setting.
During the 1990s, Hillcrest saw a big change in its population. Many white residents moved away. By 2000, the community had become mostly African-American. Experts say there wasn't one single reason for these changes. Many families moved because their children grew up. Others wanted lower property taxes or moved to warmer places after retiring.
When many Jewish families left in the 1990s, some local businesses closed. These included kosher butcher shops and bakeries. These shops had been open for over thirty years.
Geography of Hillcrest
Hillcrest is located at 41°7′47″N 74°2′8″W / 41.12972°N 74.03556°W. It covers about 1.3 square miles (3.38 square kilometers) of land. There is no water area within Hillcrest.
Location and Borders
Hillcrest is on the eastern side of the town of Ramapo. It is about halfway between Haverstraw to the north and the New Jersey border to the south.
Hillcrest shares its borders with several other communities:
- To the north: The villages of New Hempstead and New Square.
- To the south: The village of Spring Valley and an area of Ramapo.
- To the east: An area of the town of Clarkstown.
- To the west: The villages of New Hempstead and Viola.
Population and Demographics
The population of Hillcrest has changed over the years. Here's how it looked in recent censuses:
| Historical population | |||
|---|---|---|---|
| Census | Pop. | %± | |
| 2010 | 7,558 | — | |
| 2020 | 8,164 | 8.0% | |
| U.S. Decennial Census 2010 2020 |
|||
2020 Census Information
The United States Census Bureau collects information about people living in different areas. This helps us understand the community better. The table below shows the different racial and ethnic groups in Hillcrest in 2010 and 2020.
It's important to know that the US Census counts people who are Hispanic or Latino as an ethnic group. This means they can be of any race. The table separates them from the racial categories.
| Race / Ethnicity (NH = Non-Hispanic) | Pop 2010 | Pop 2020 | % 2010 | % 2020 |
|---|---|---|---|---|
| White alone (NH) | 943 | 881 | 12.48% | 10.79% |
| Black or African American alone (NH) | 4,065 | 3,070 | 53.78% | 37.60% |
| Native American or Alaska Native alone (NH) | 14 | 47 | 0.19% | 0.58% |
| Asian alone (NH) | 817 | 599 | 10.81% | 7.34% |
| Pacific Islander alone (NH) | 4 | 0 | 0.05% | 0.00% |
| Some Other Race alone (NH) | 50 | 75 | 0.66% | 0.92% |
| Mixed Race or Multi-Racial (NH) | 154 | 131 | 2.04% | 1.60% |
| Hispanic or Latino (any race) | 1,511 | 3,361 | 19.99% | 41.17% |
| Total | 7,558 | 8,164 | 100.00% | 100.00% |
Education in Hillcrest
Students in Hillcrest attend schools within the East Ramapo Central School District.
See also
 In Spanish: Hillcrest (condado de Rockland) para niños
 | Jackie Robinson |
 | Jack Johnson |
 | Althea Gibson |
 | Arthur Ashe |
 | Muhammad Ali |


